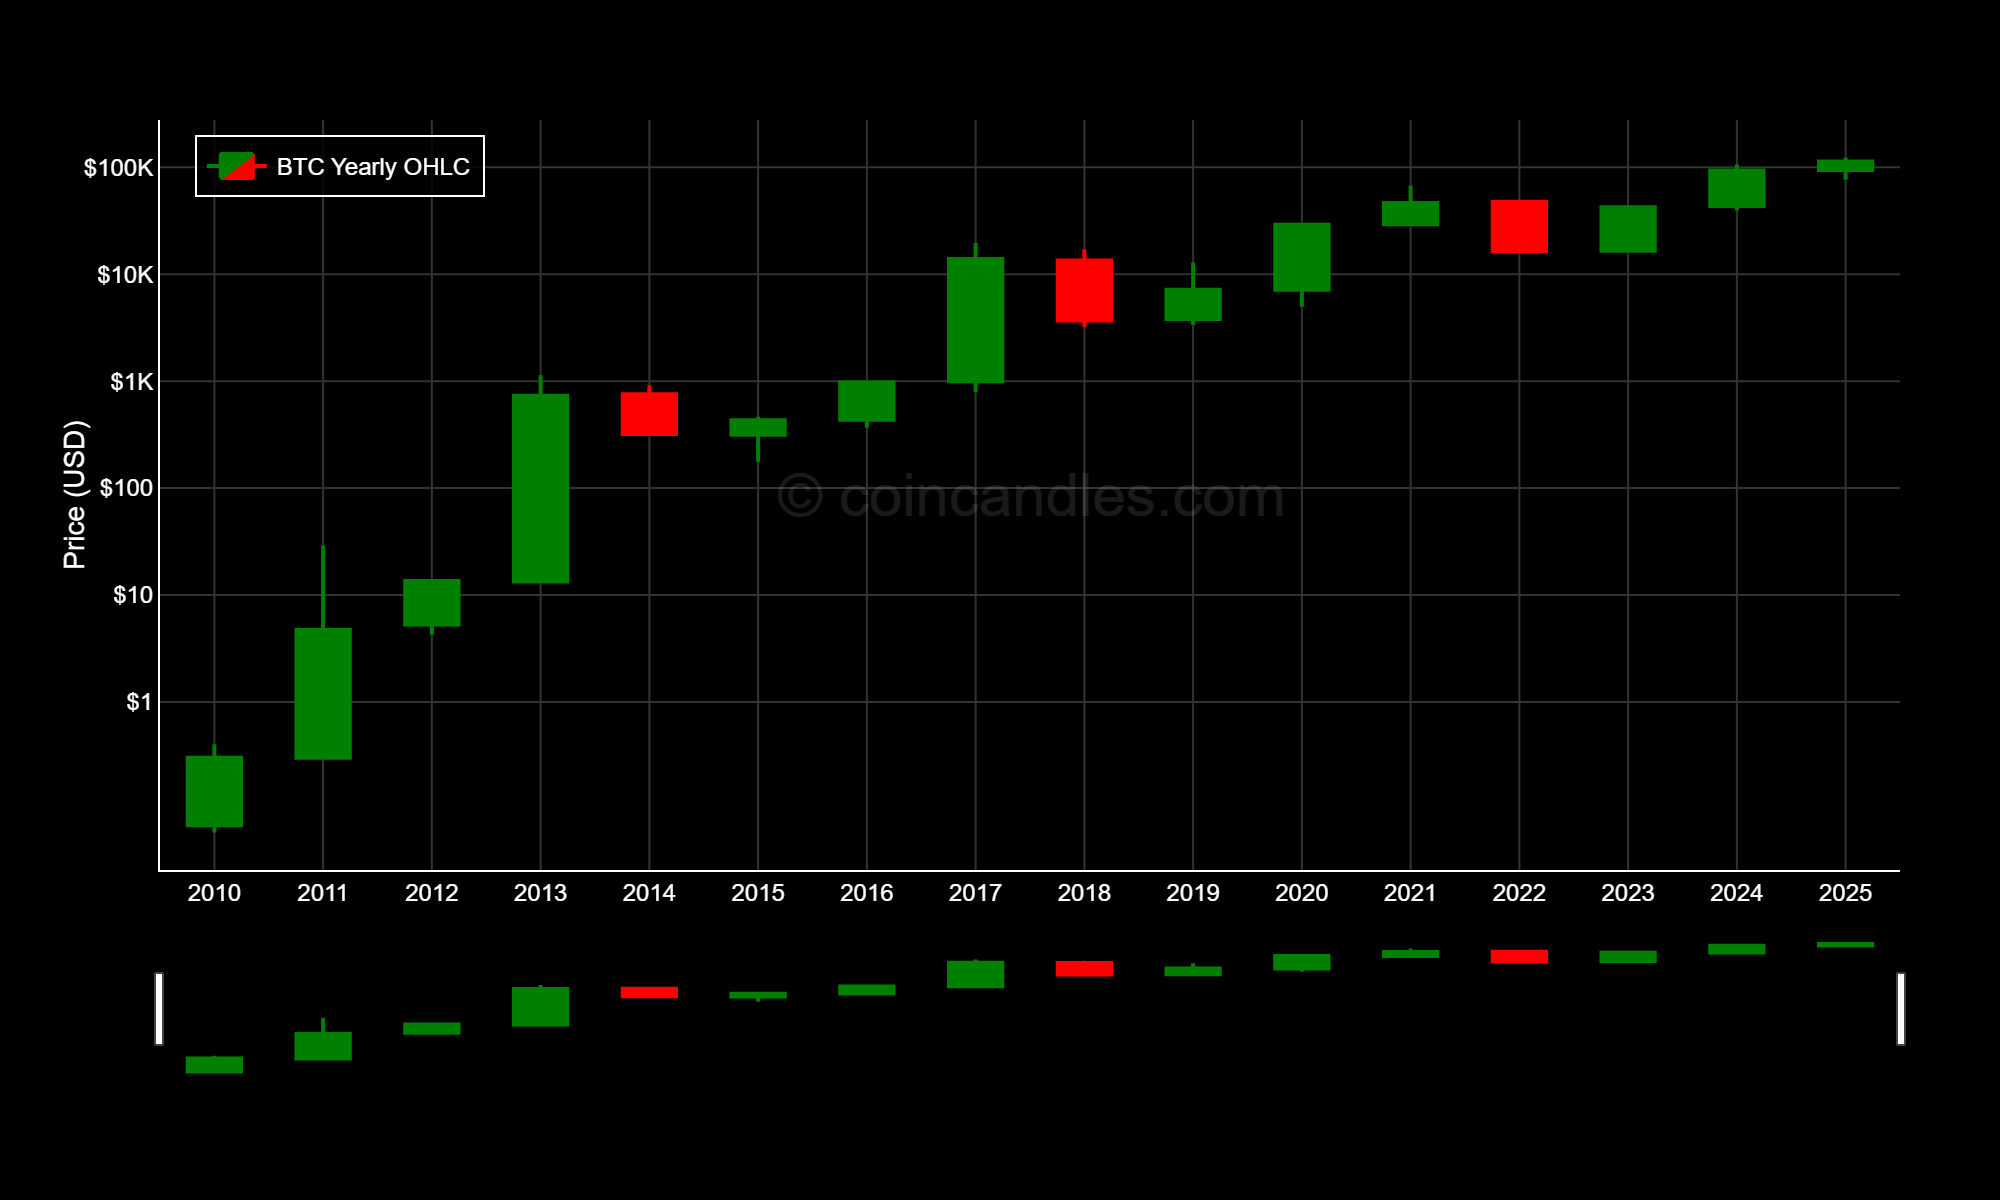
BTC Yearly Candles
The Bitcoin Yearly Candles Chart shows long-term price action in a simple, high-timeframe view.
Learn More
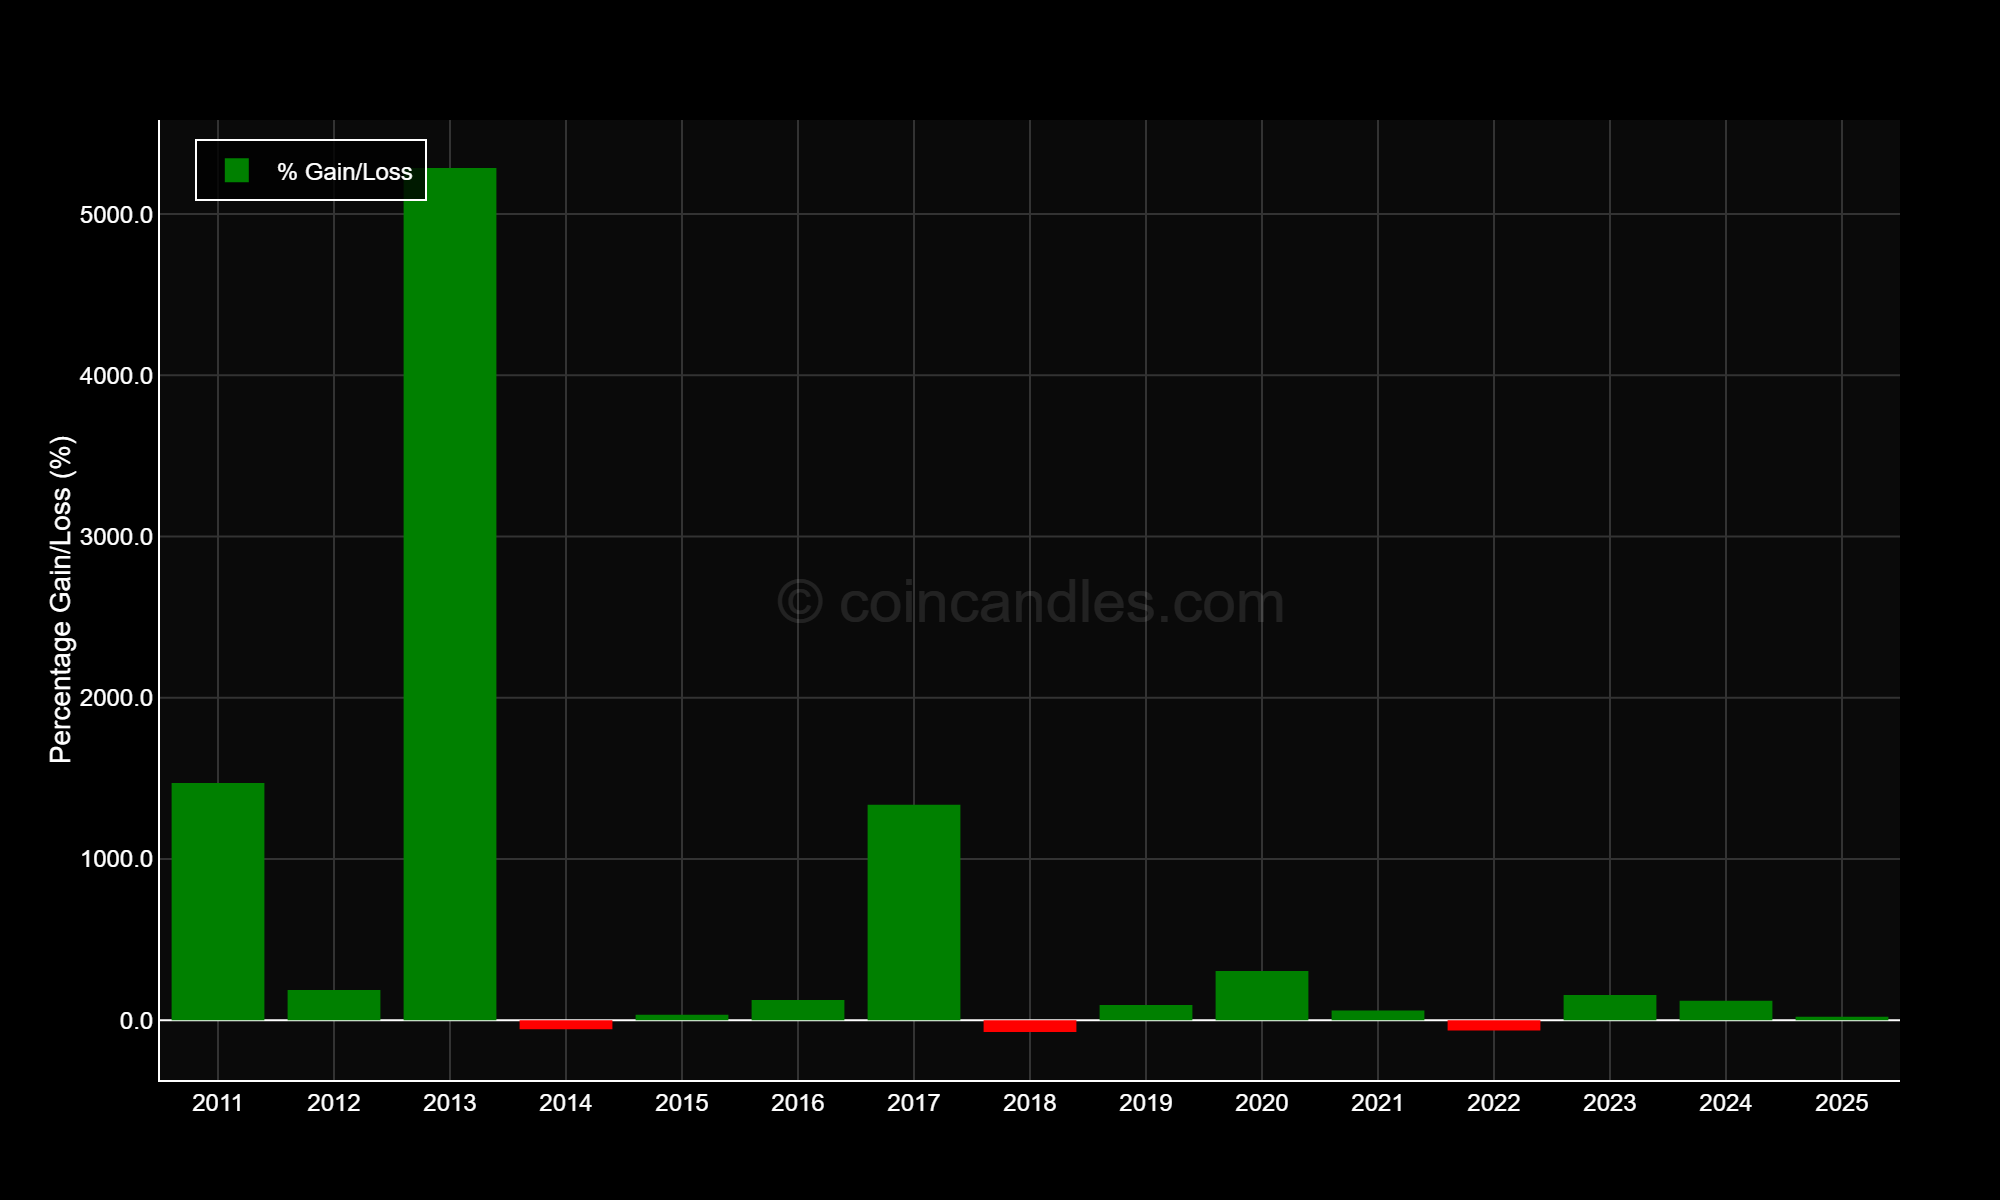
BTC Yearly Price Performance
The Bitcoin Yearly Price Performance Chart presents Bitcoin's annual percentage returns in a clear bar format—green for positive years, red for negative.
Learn More
Monthly Returns Table
This table displays the monthly ROI for Bitcoin, measured against USD. Each cell shows the percentage gain or loss for Bitcoin in a given month.
Learn More
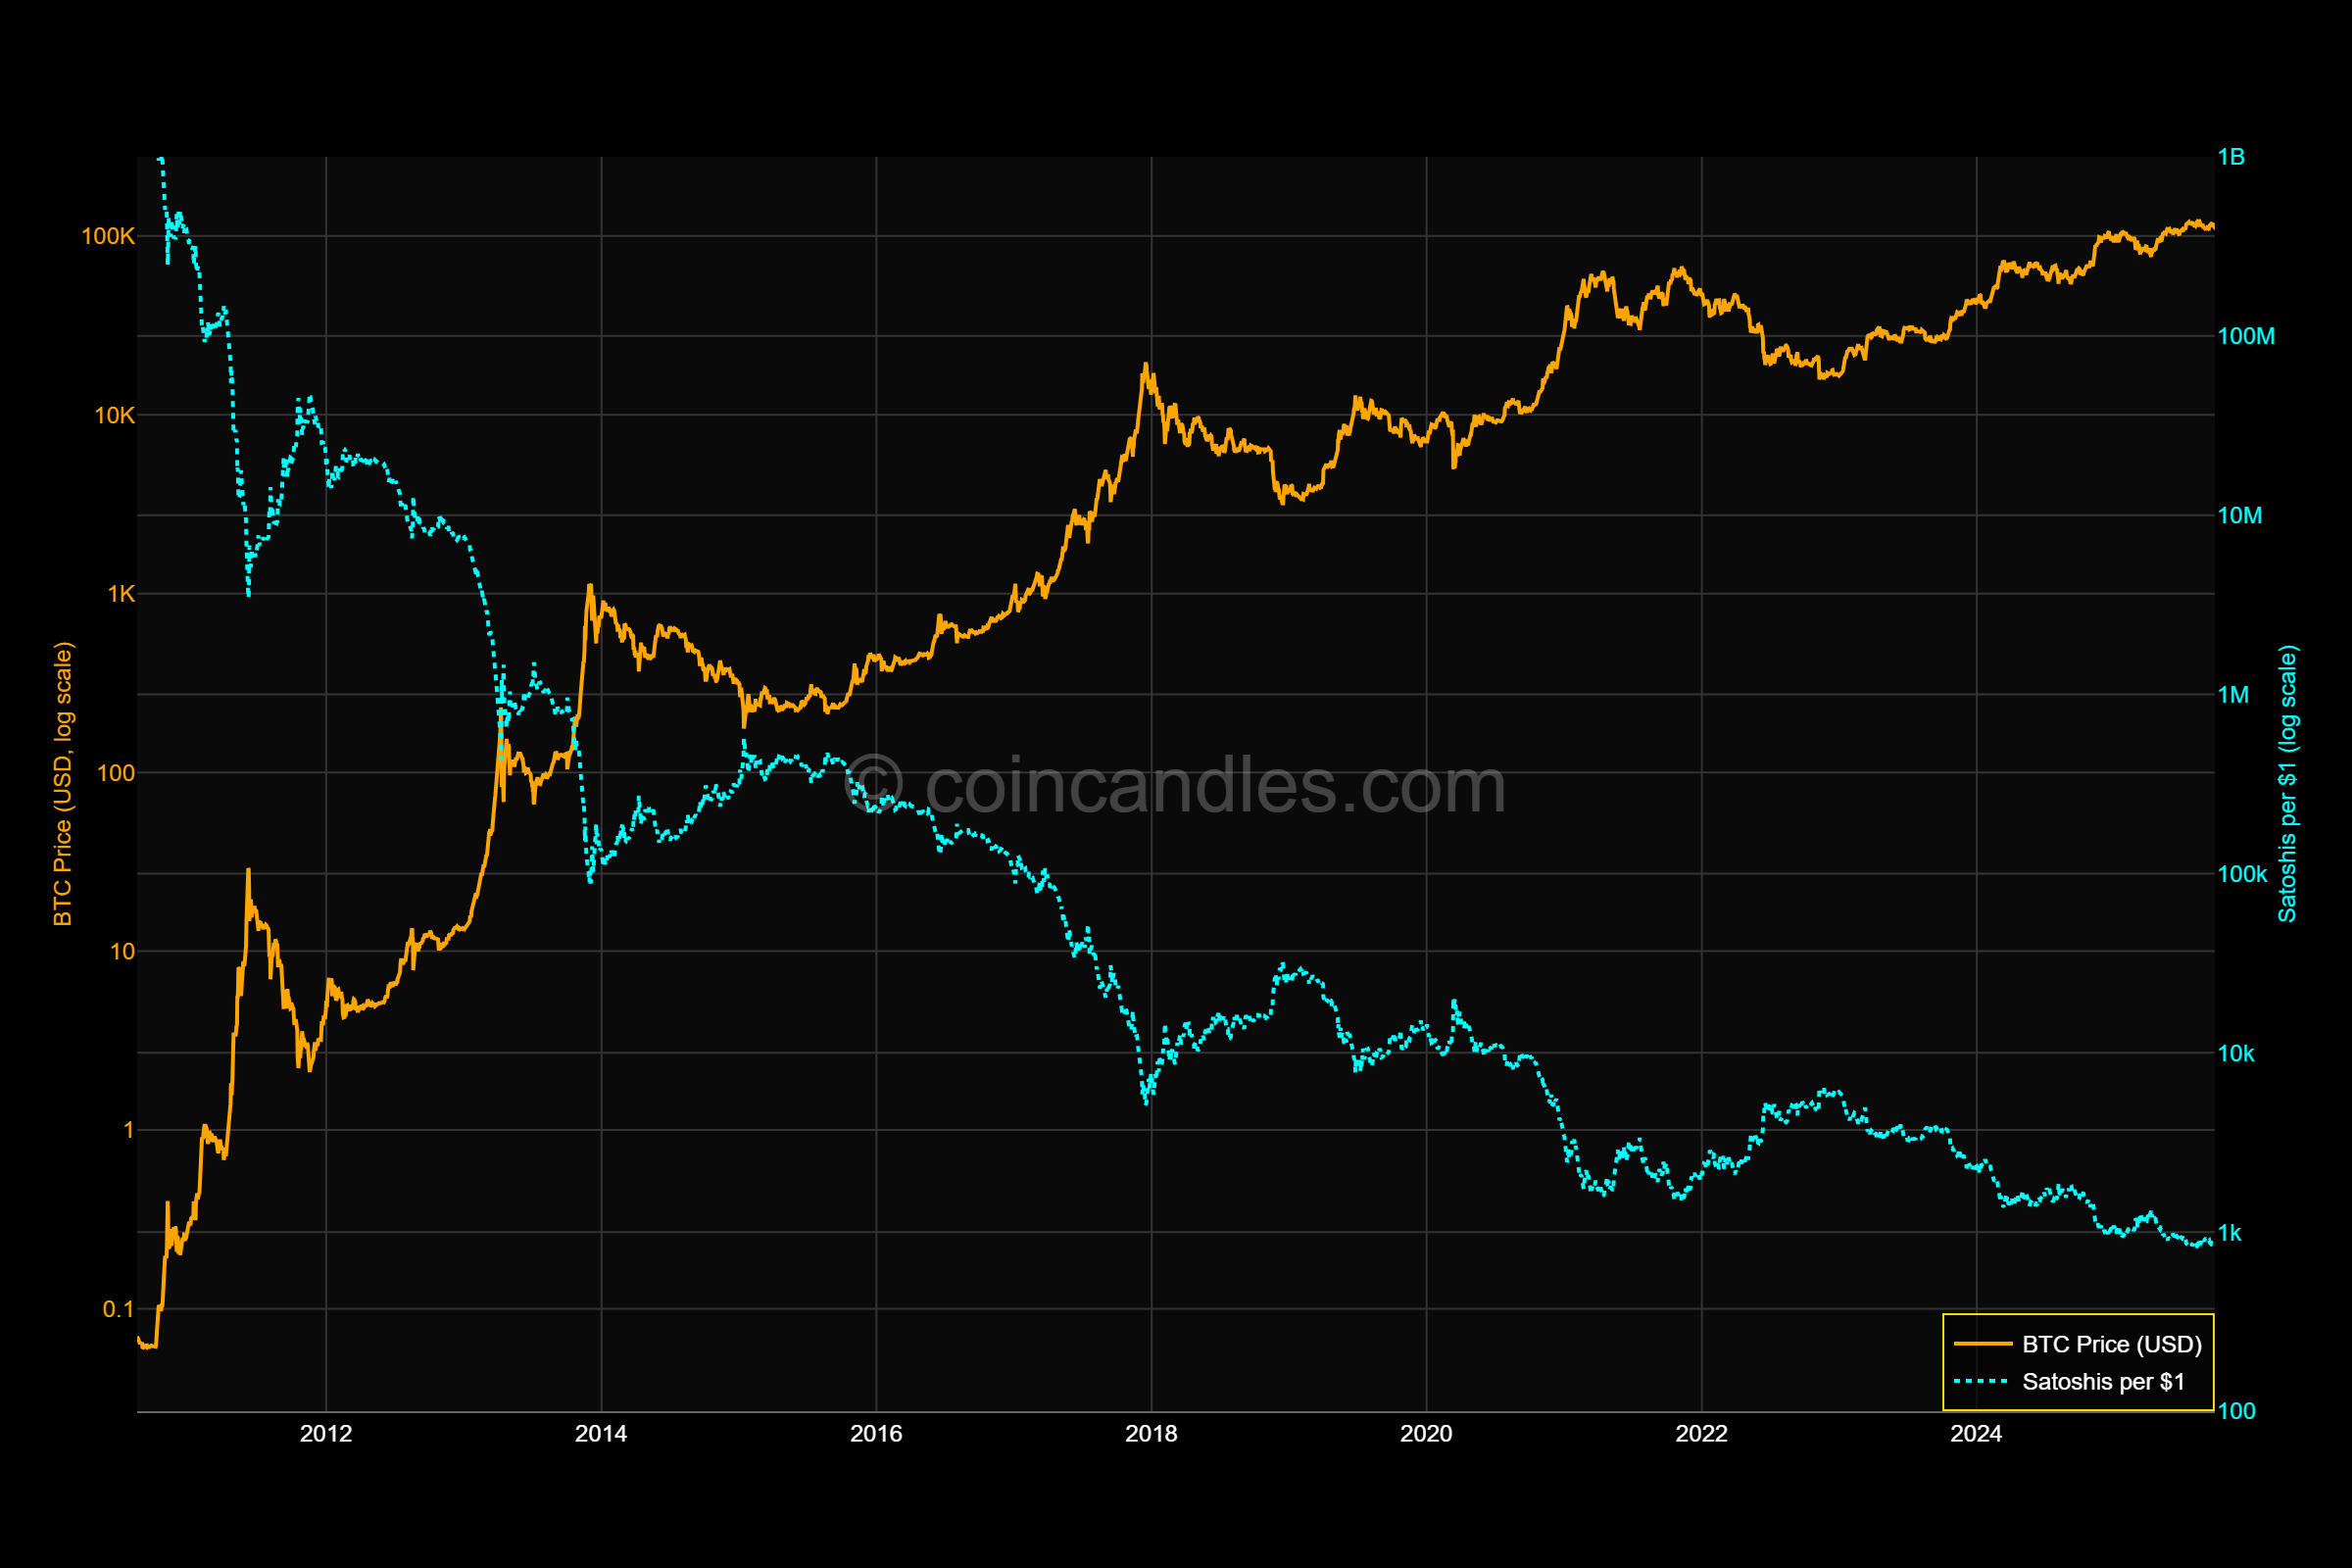
Satoshi per Dollar
The Mayer Multiple is a Bitcoin valuation metric created by Trace Mayer.,
Learn More
Pi Cycle Top
The BTC Pi Cycle Top is a technical indicator that helps identify the Pi Cycle Top for Bitcoin based on regression analysis.
Learn More
Mayer Multiple
The BTC Mayer Multiple is a technical indicator that helps identify the Mayer Multiple for Bitcoin based on regression analysis.
Learn More
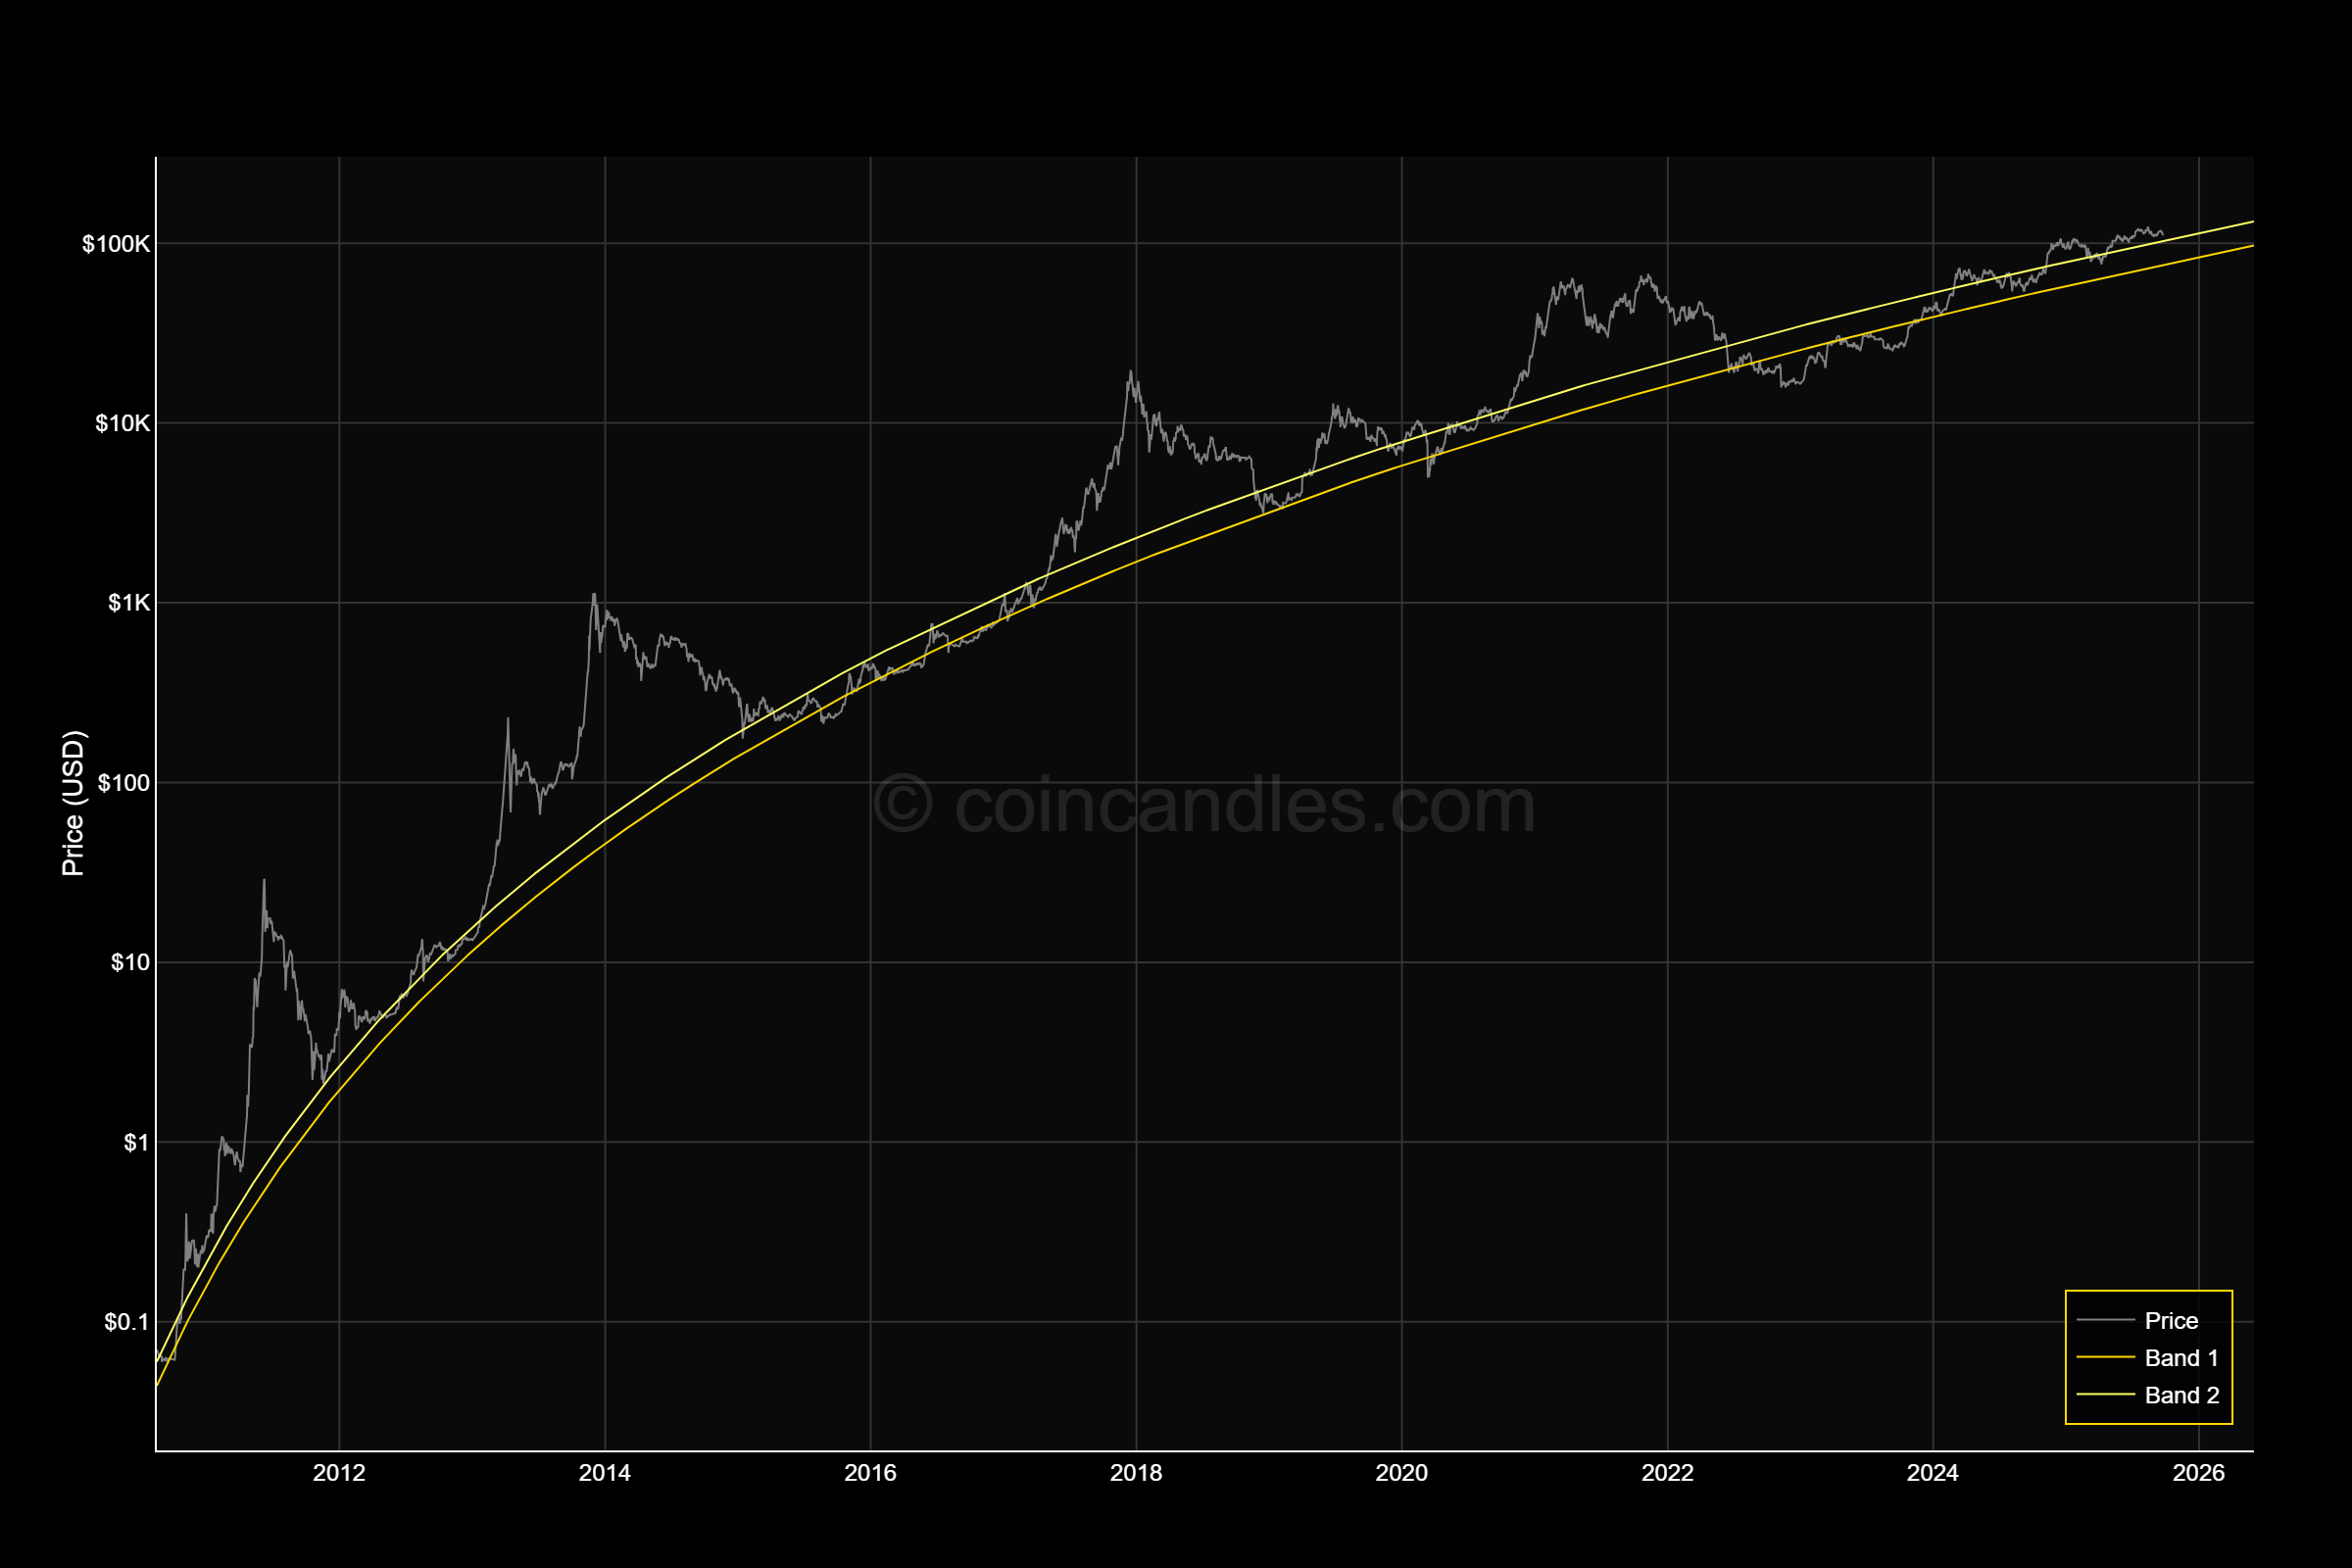
BTC Fair Value Regression Bands
Long-term price versus regression-derived bands to highlight undervalued and overheated zones.
Learn More
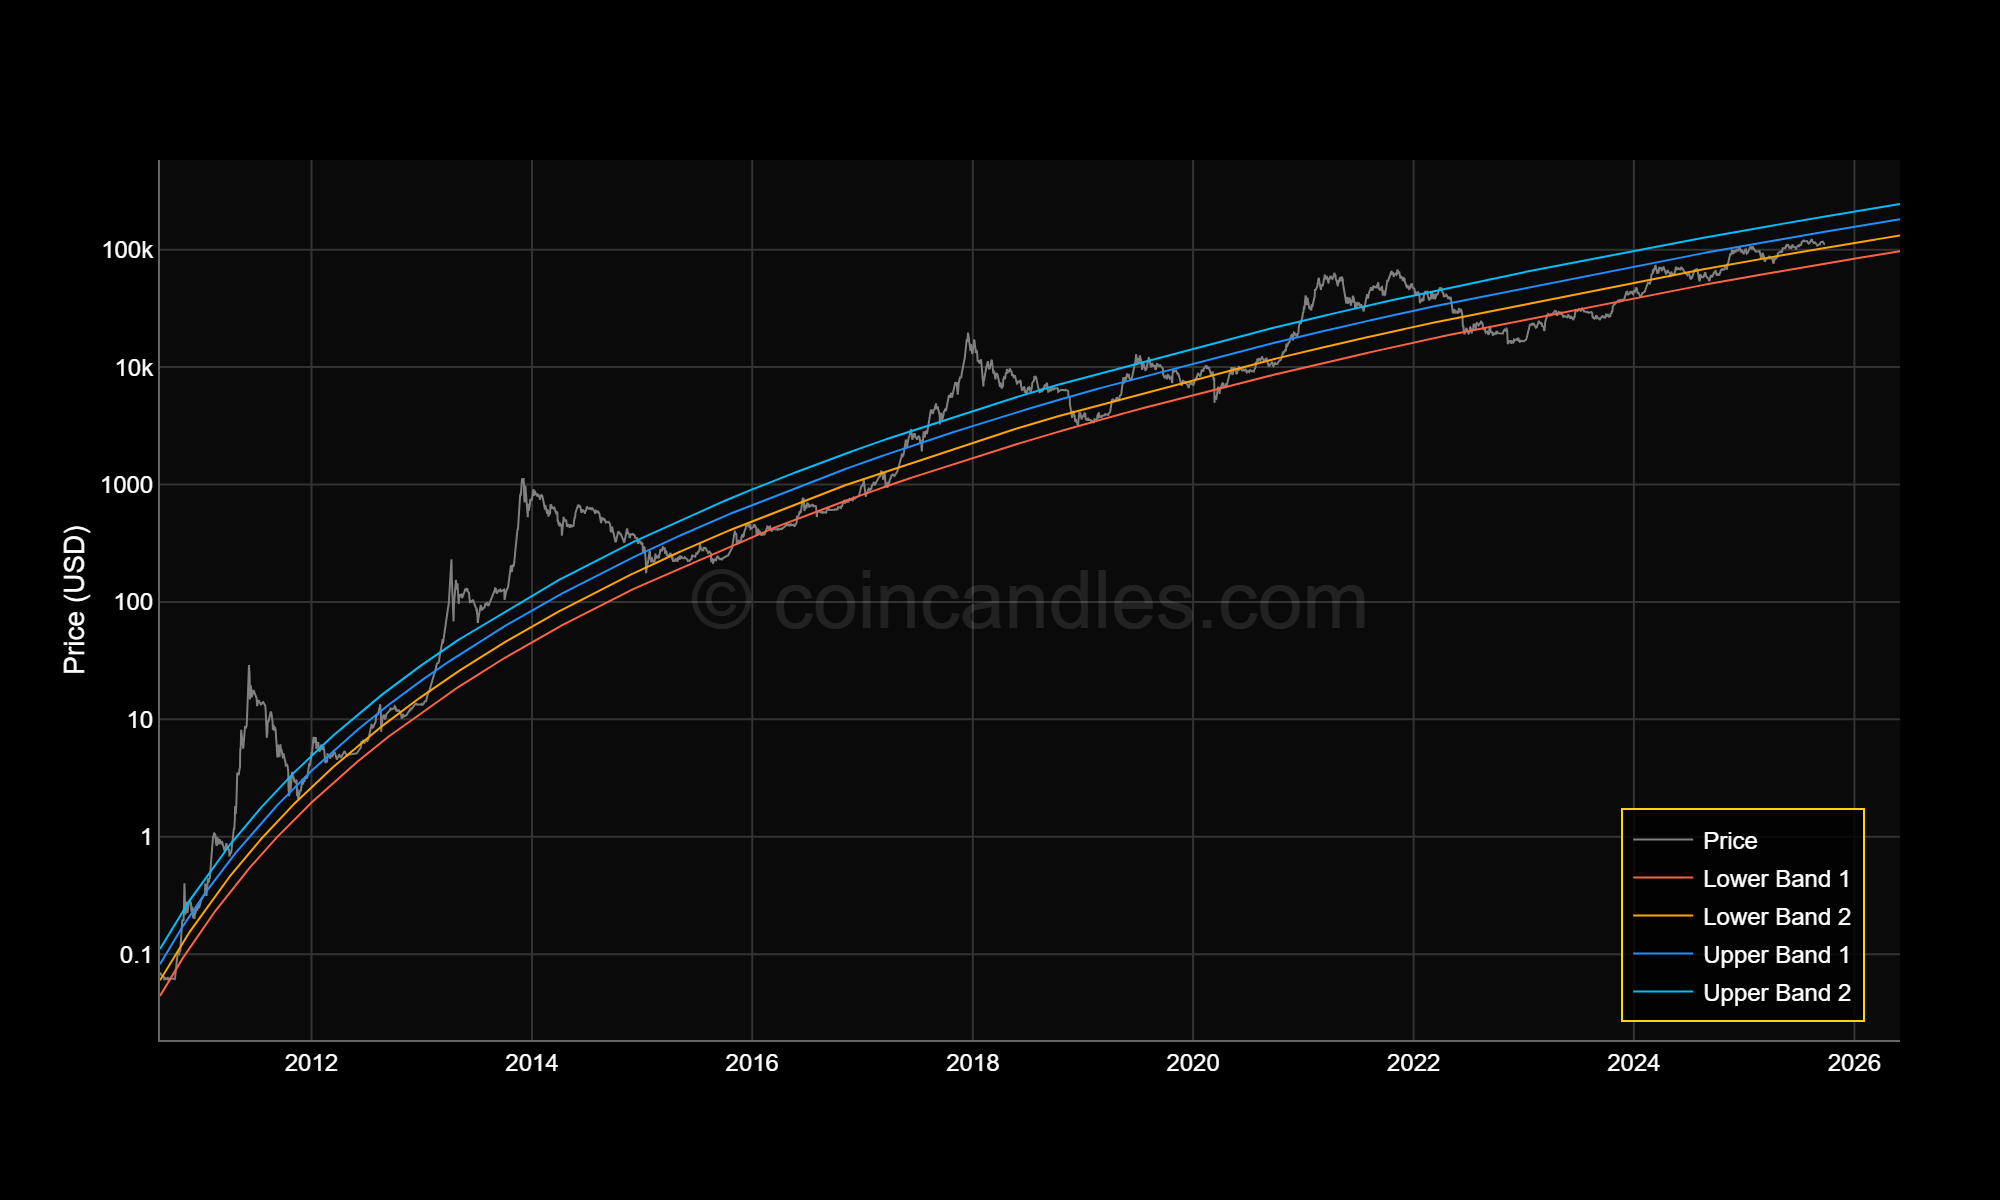
BTC Log Bands
Cycle-aware logarithmic regression channels mapping BTC’s growth trajectory across market cycles.
Learn More
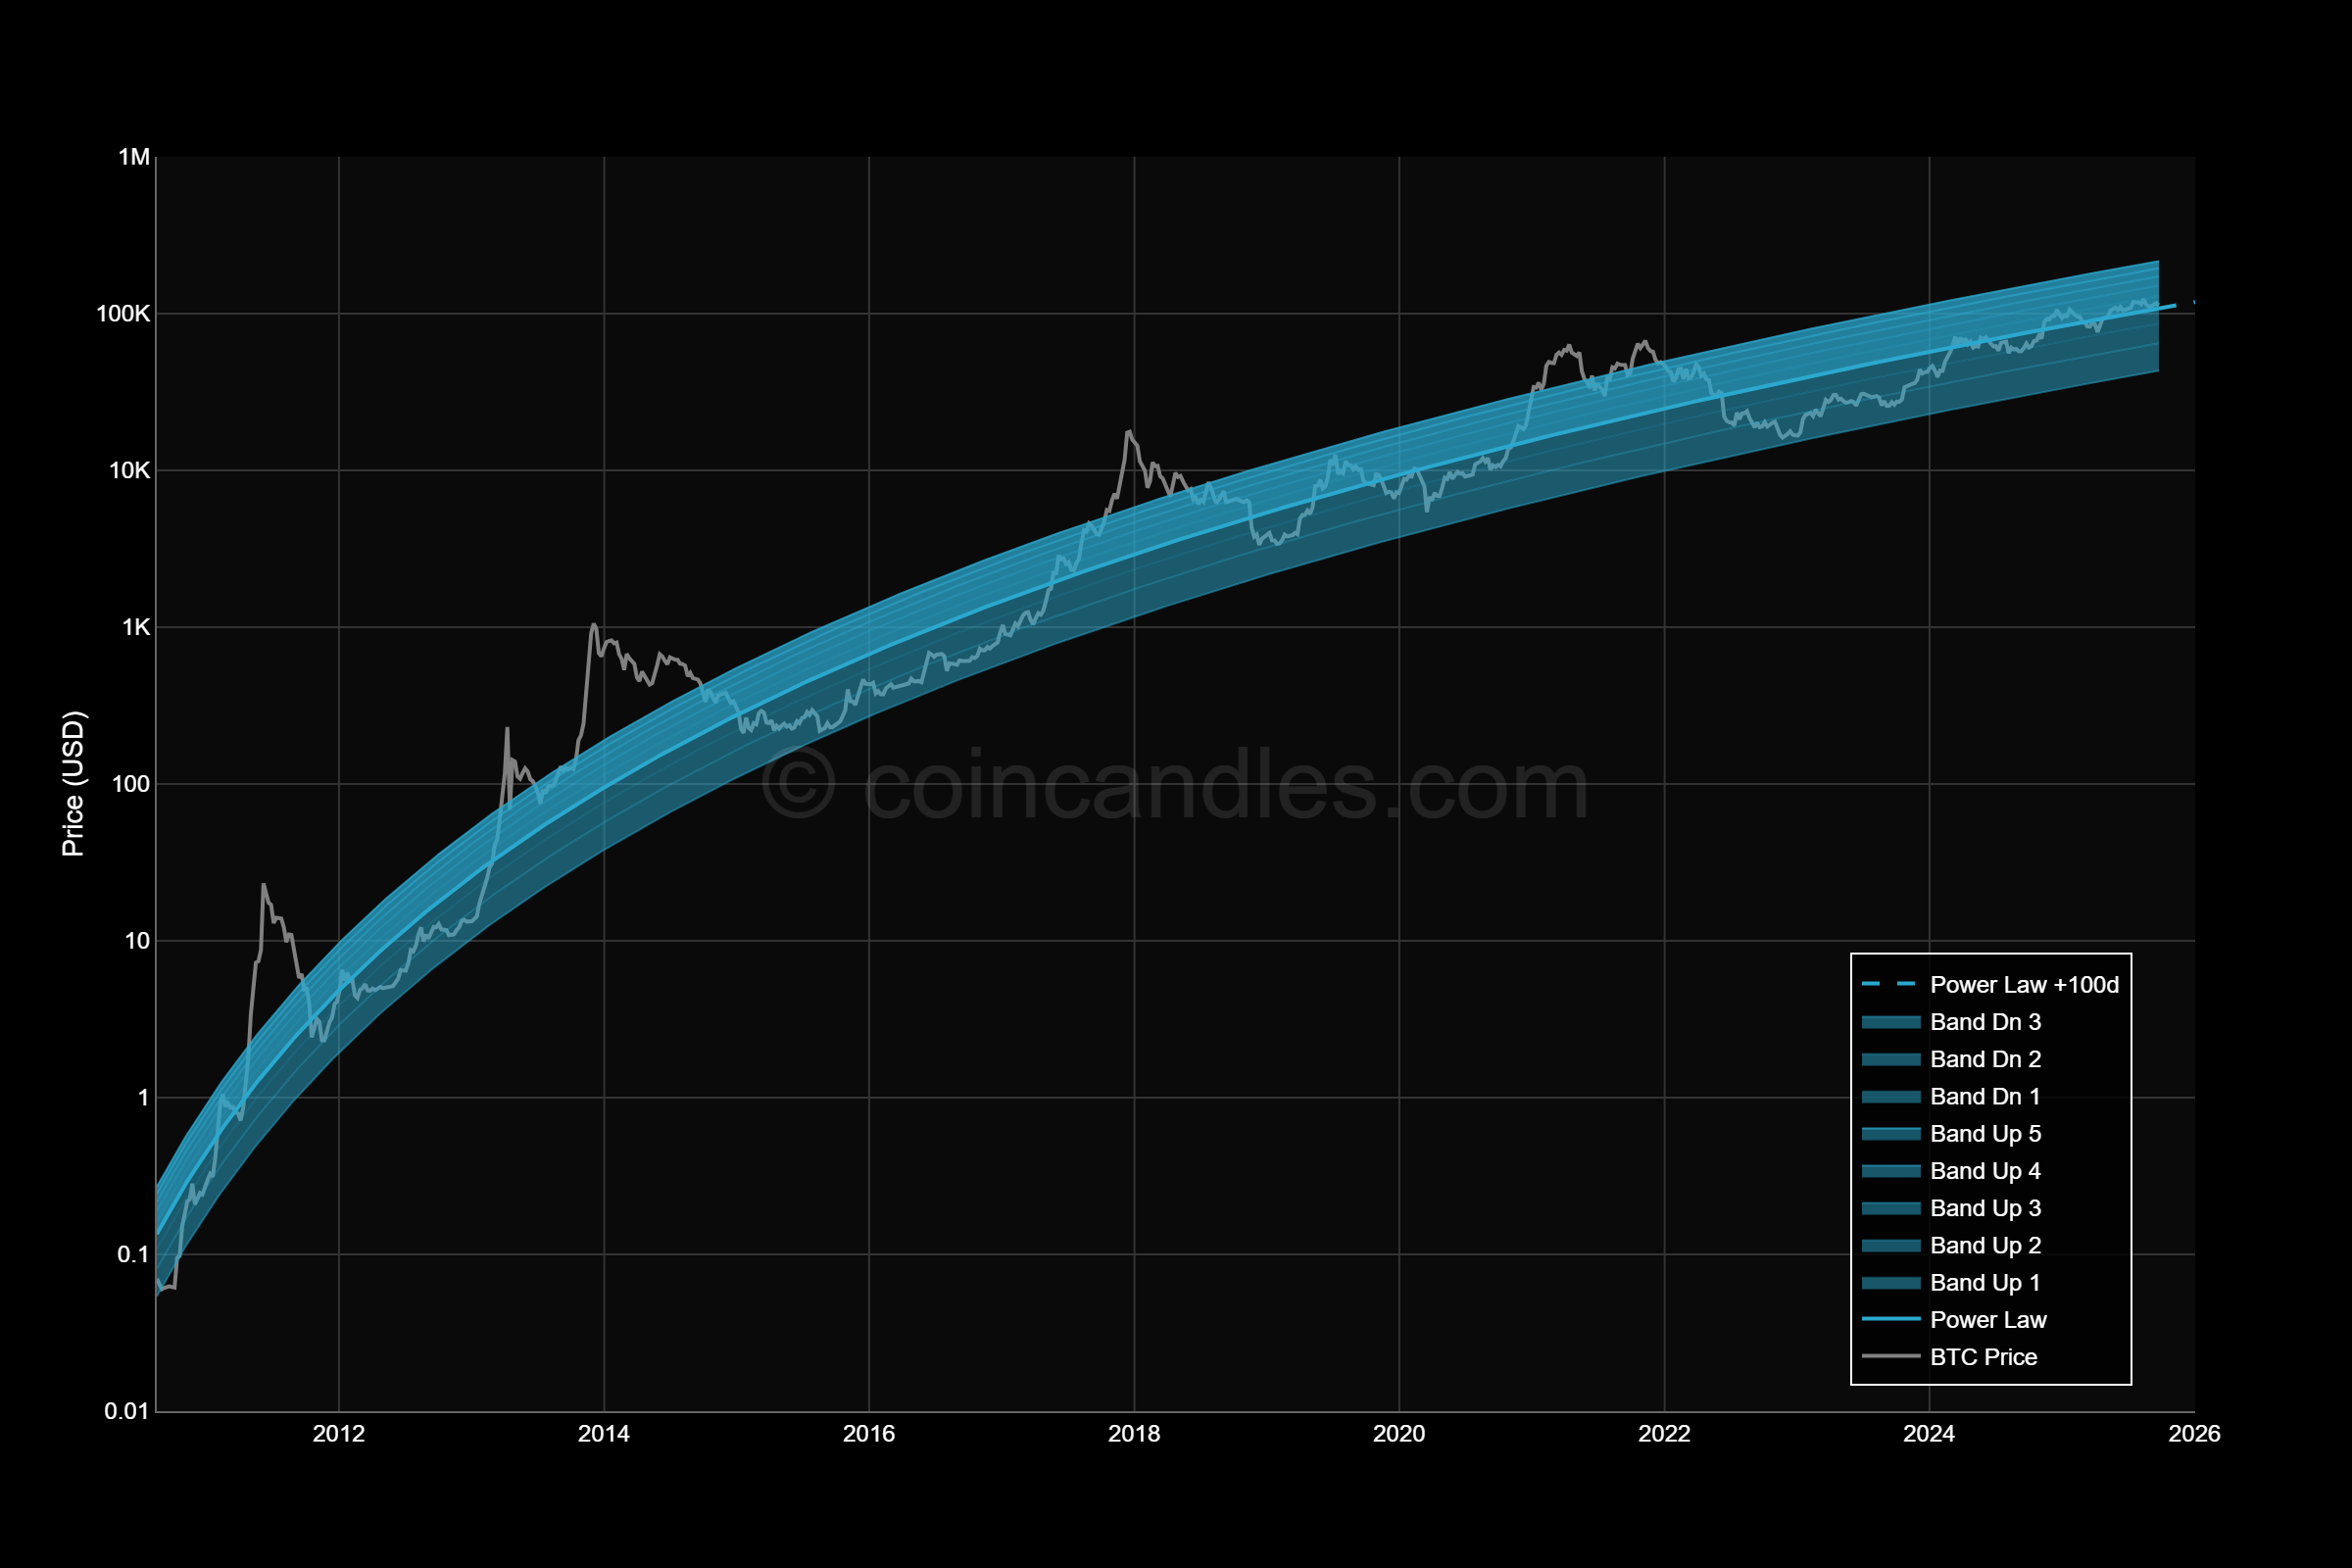
Power Law & Bands + 100 day extrapolation
Power-law fit with deviation bands and a short-term 100‑day forward price extrapolation.
Learn More
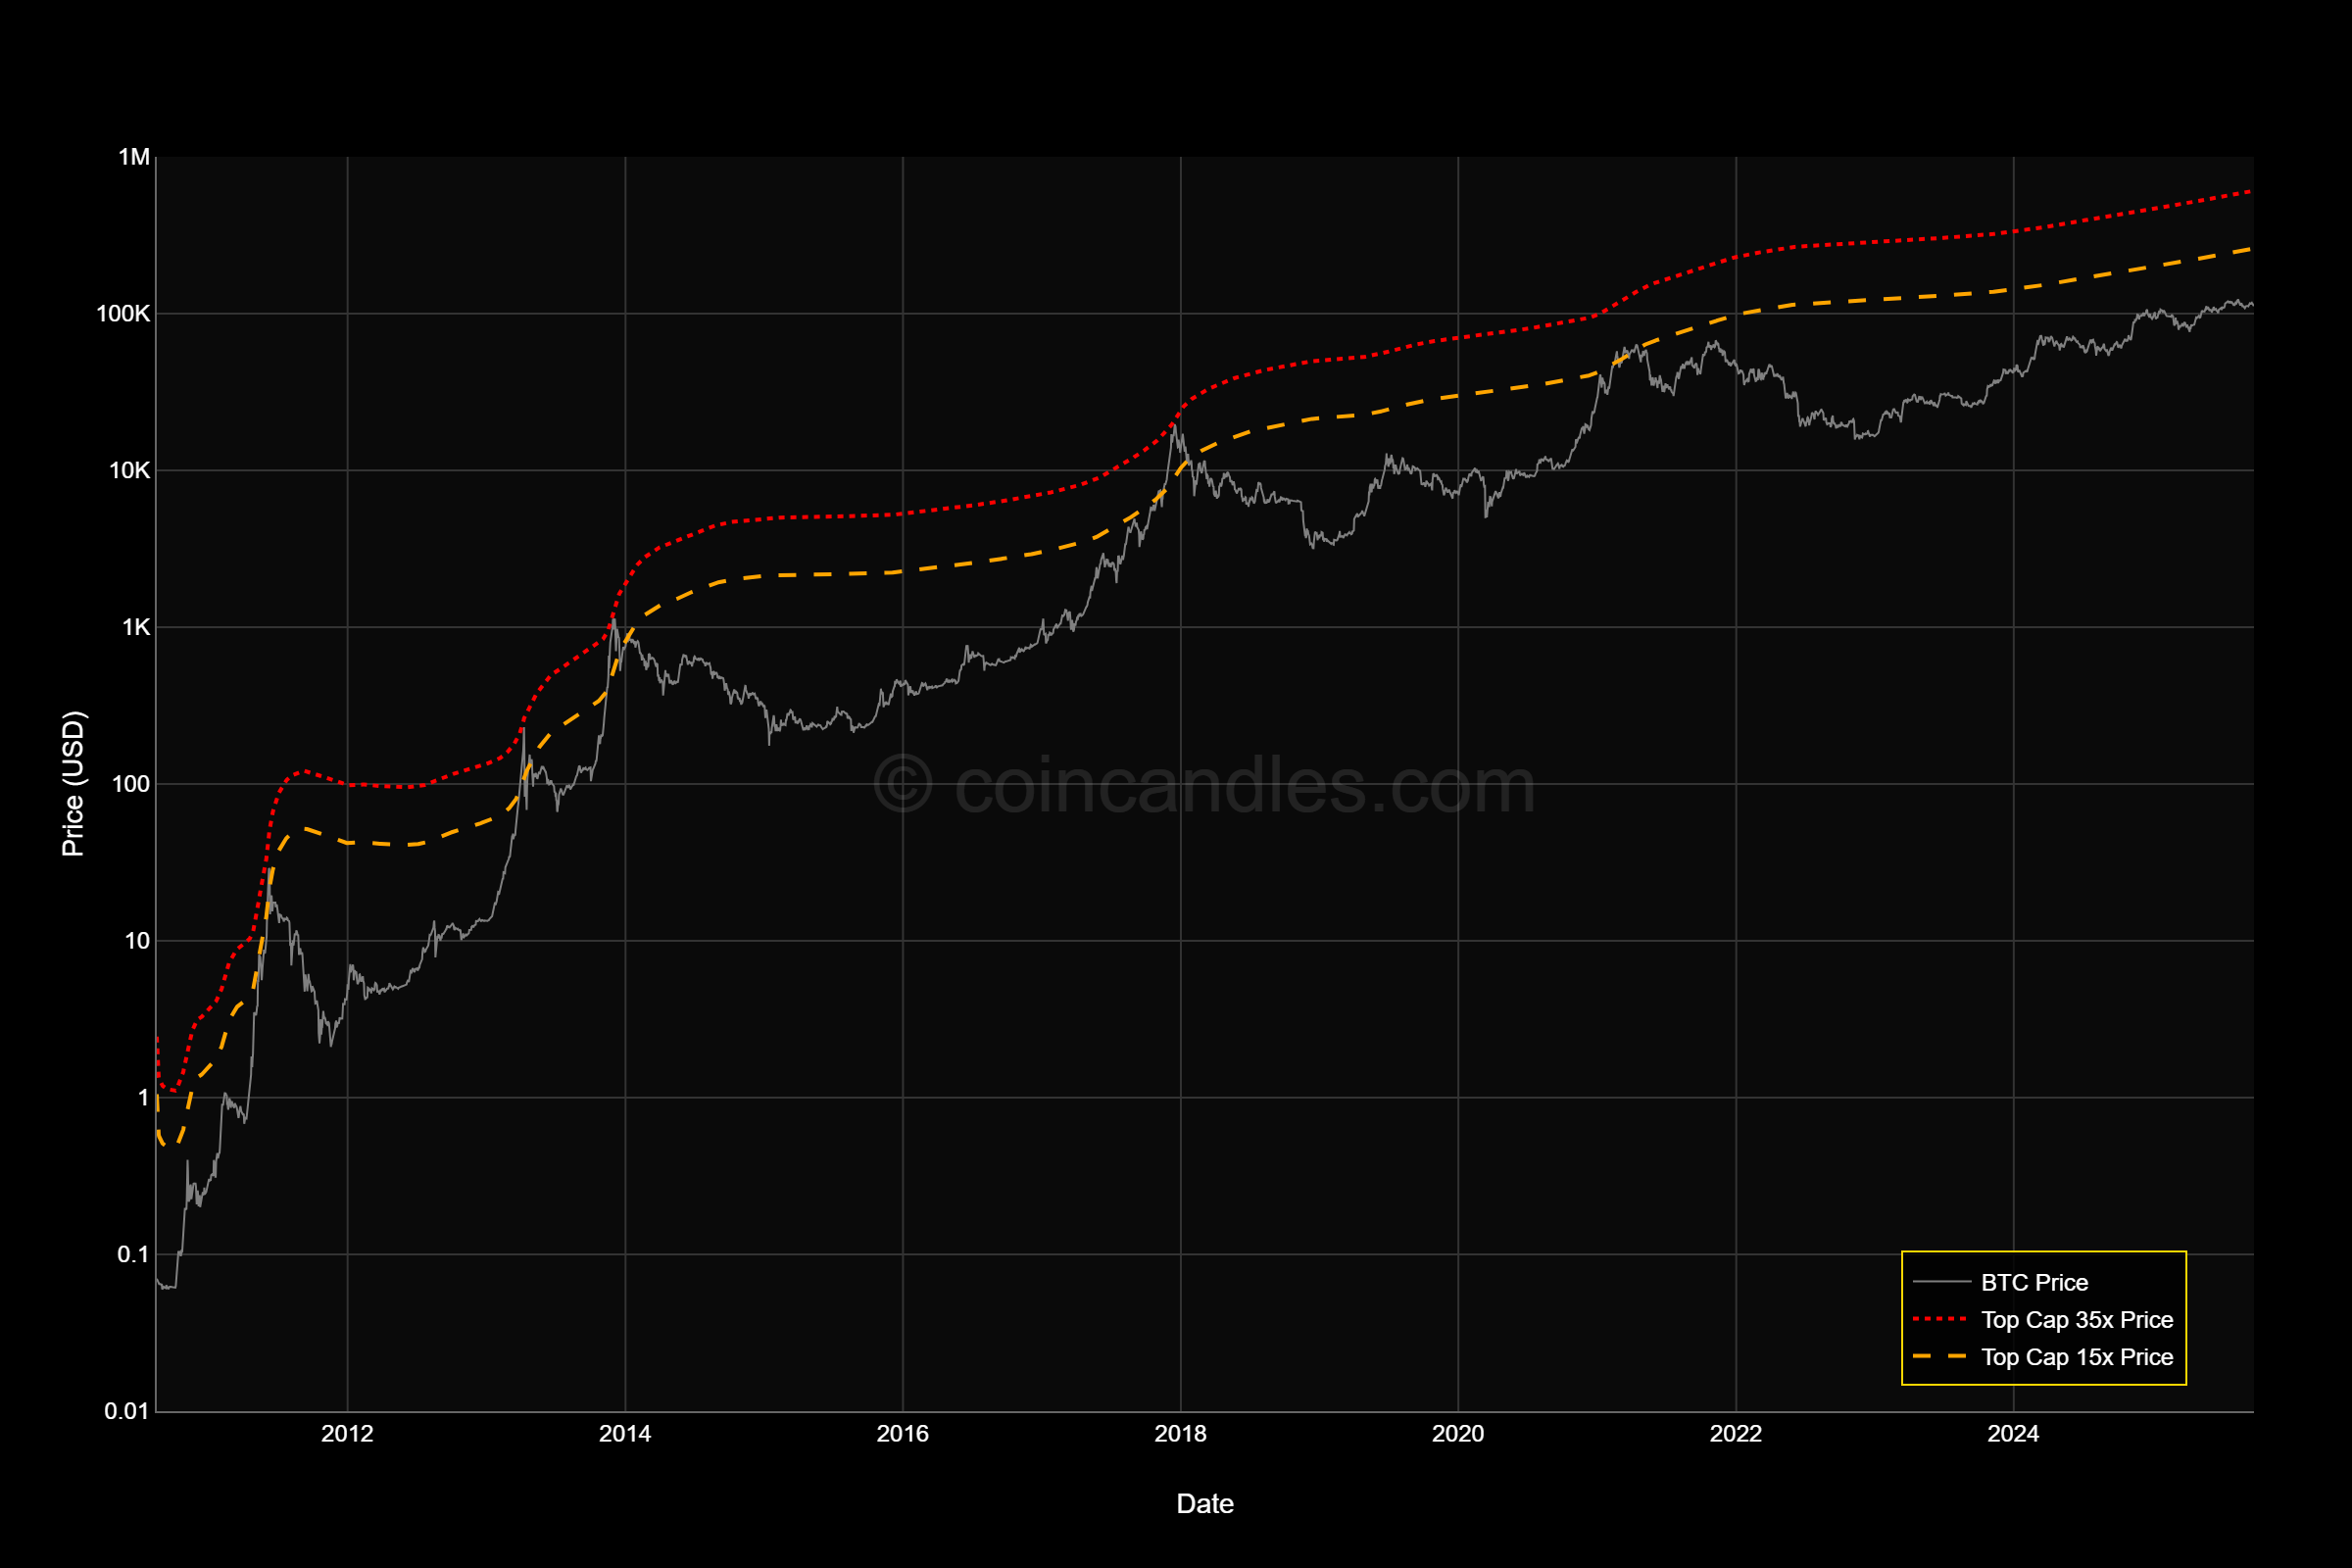
BTC Top Cap
Top Cap valuation overlay historically associated with major market cycle tops.
Learn More
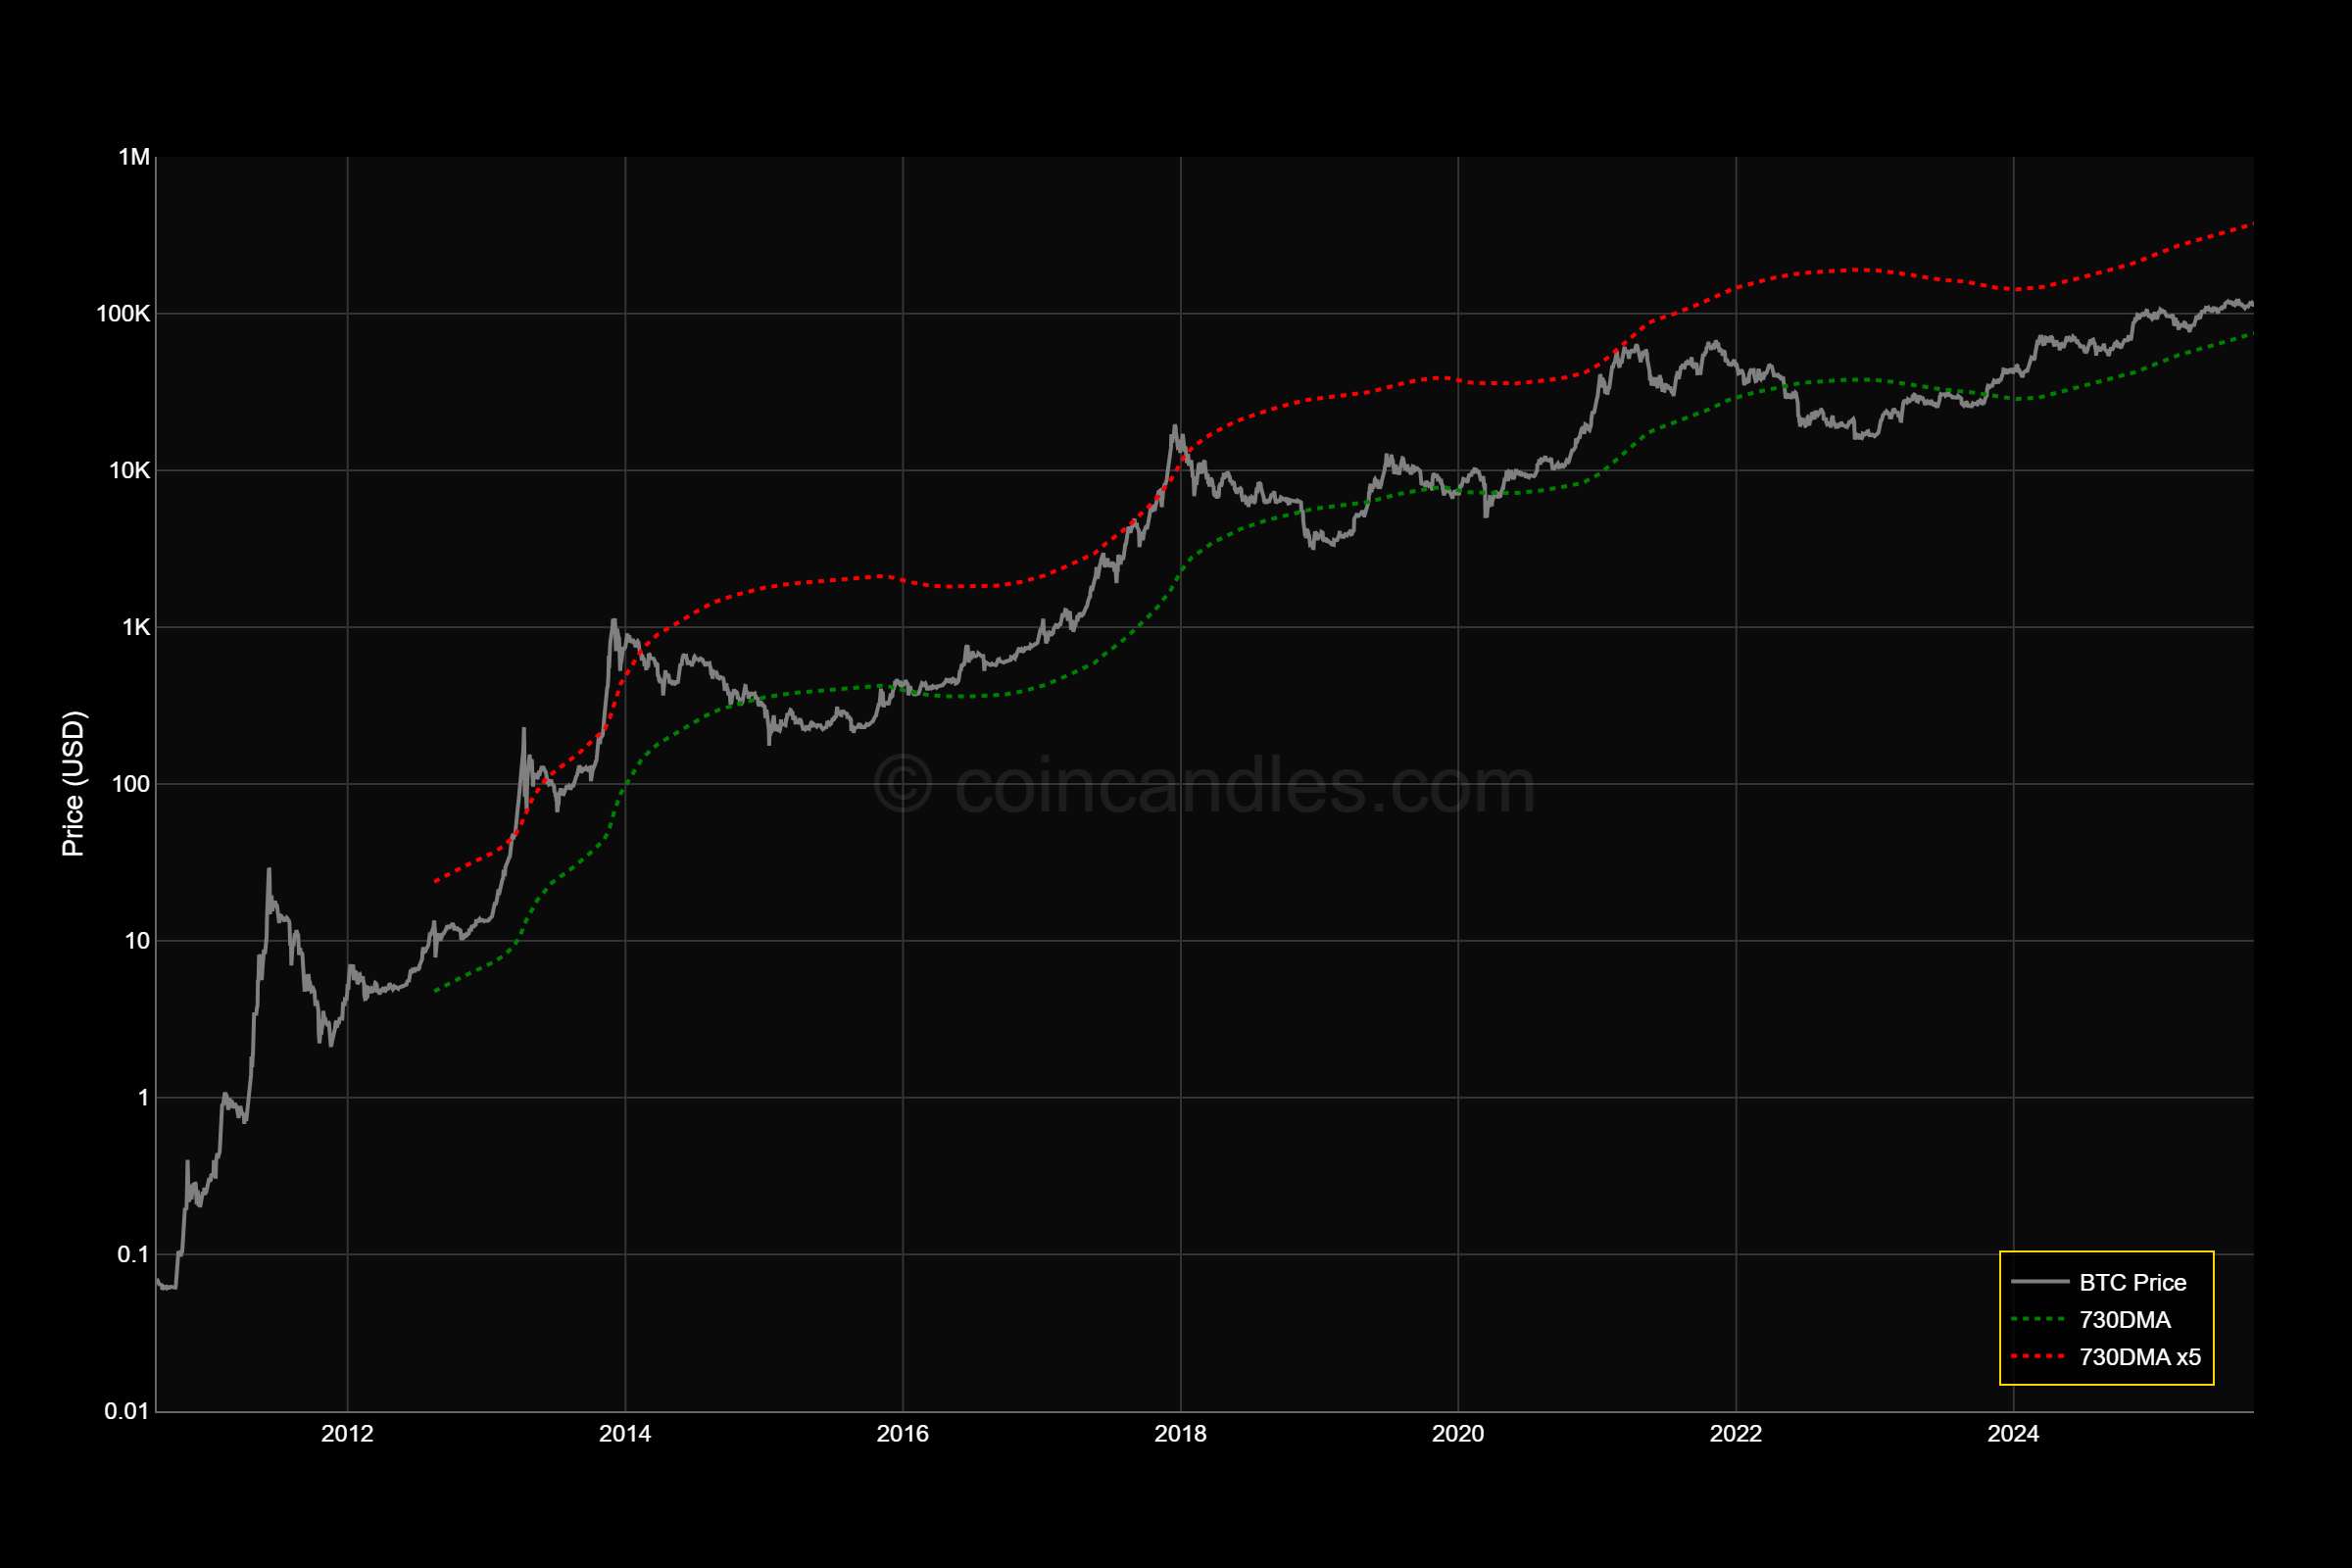
Long Term Price Bands
Two‑year SMA and 5× multiple bands acting as long‑term support/resistance guides.
Learn More
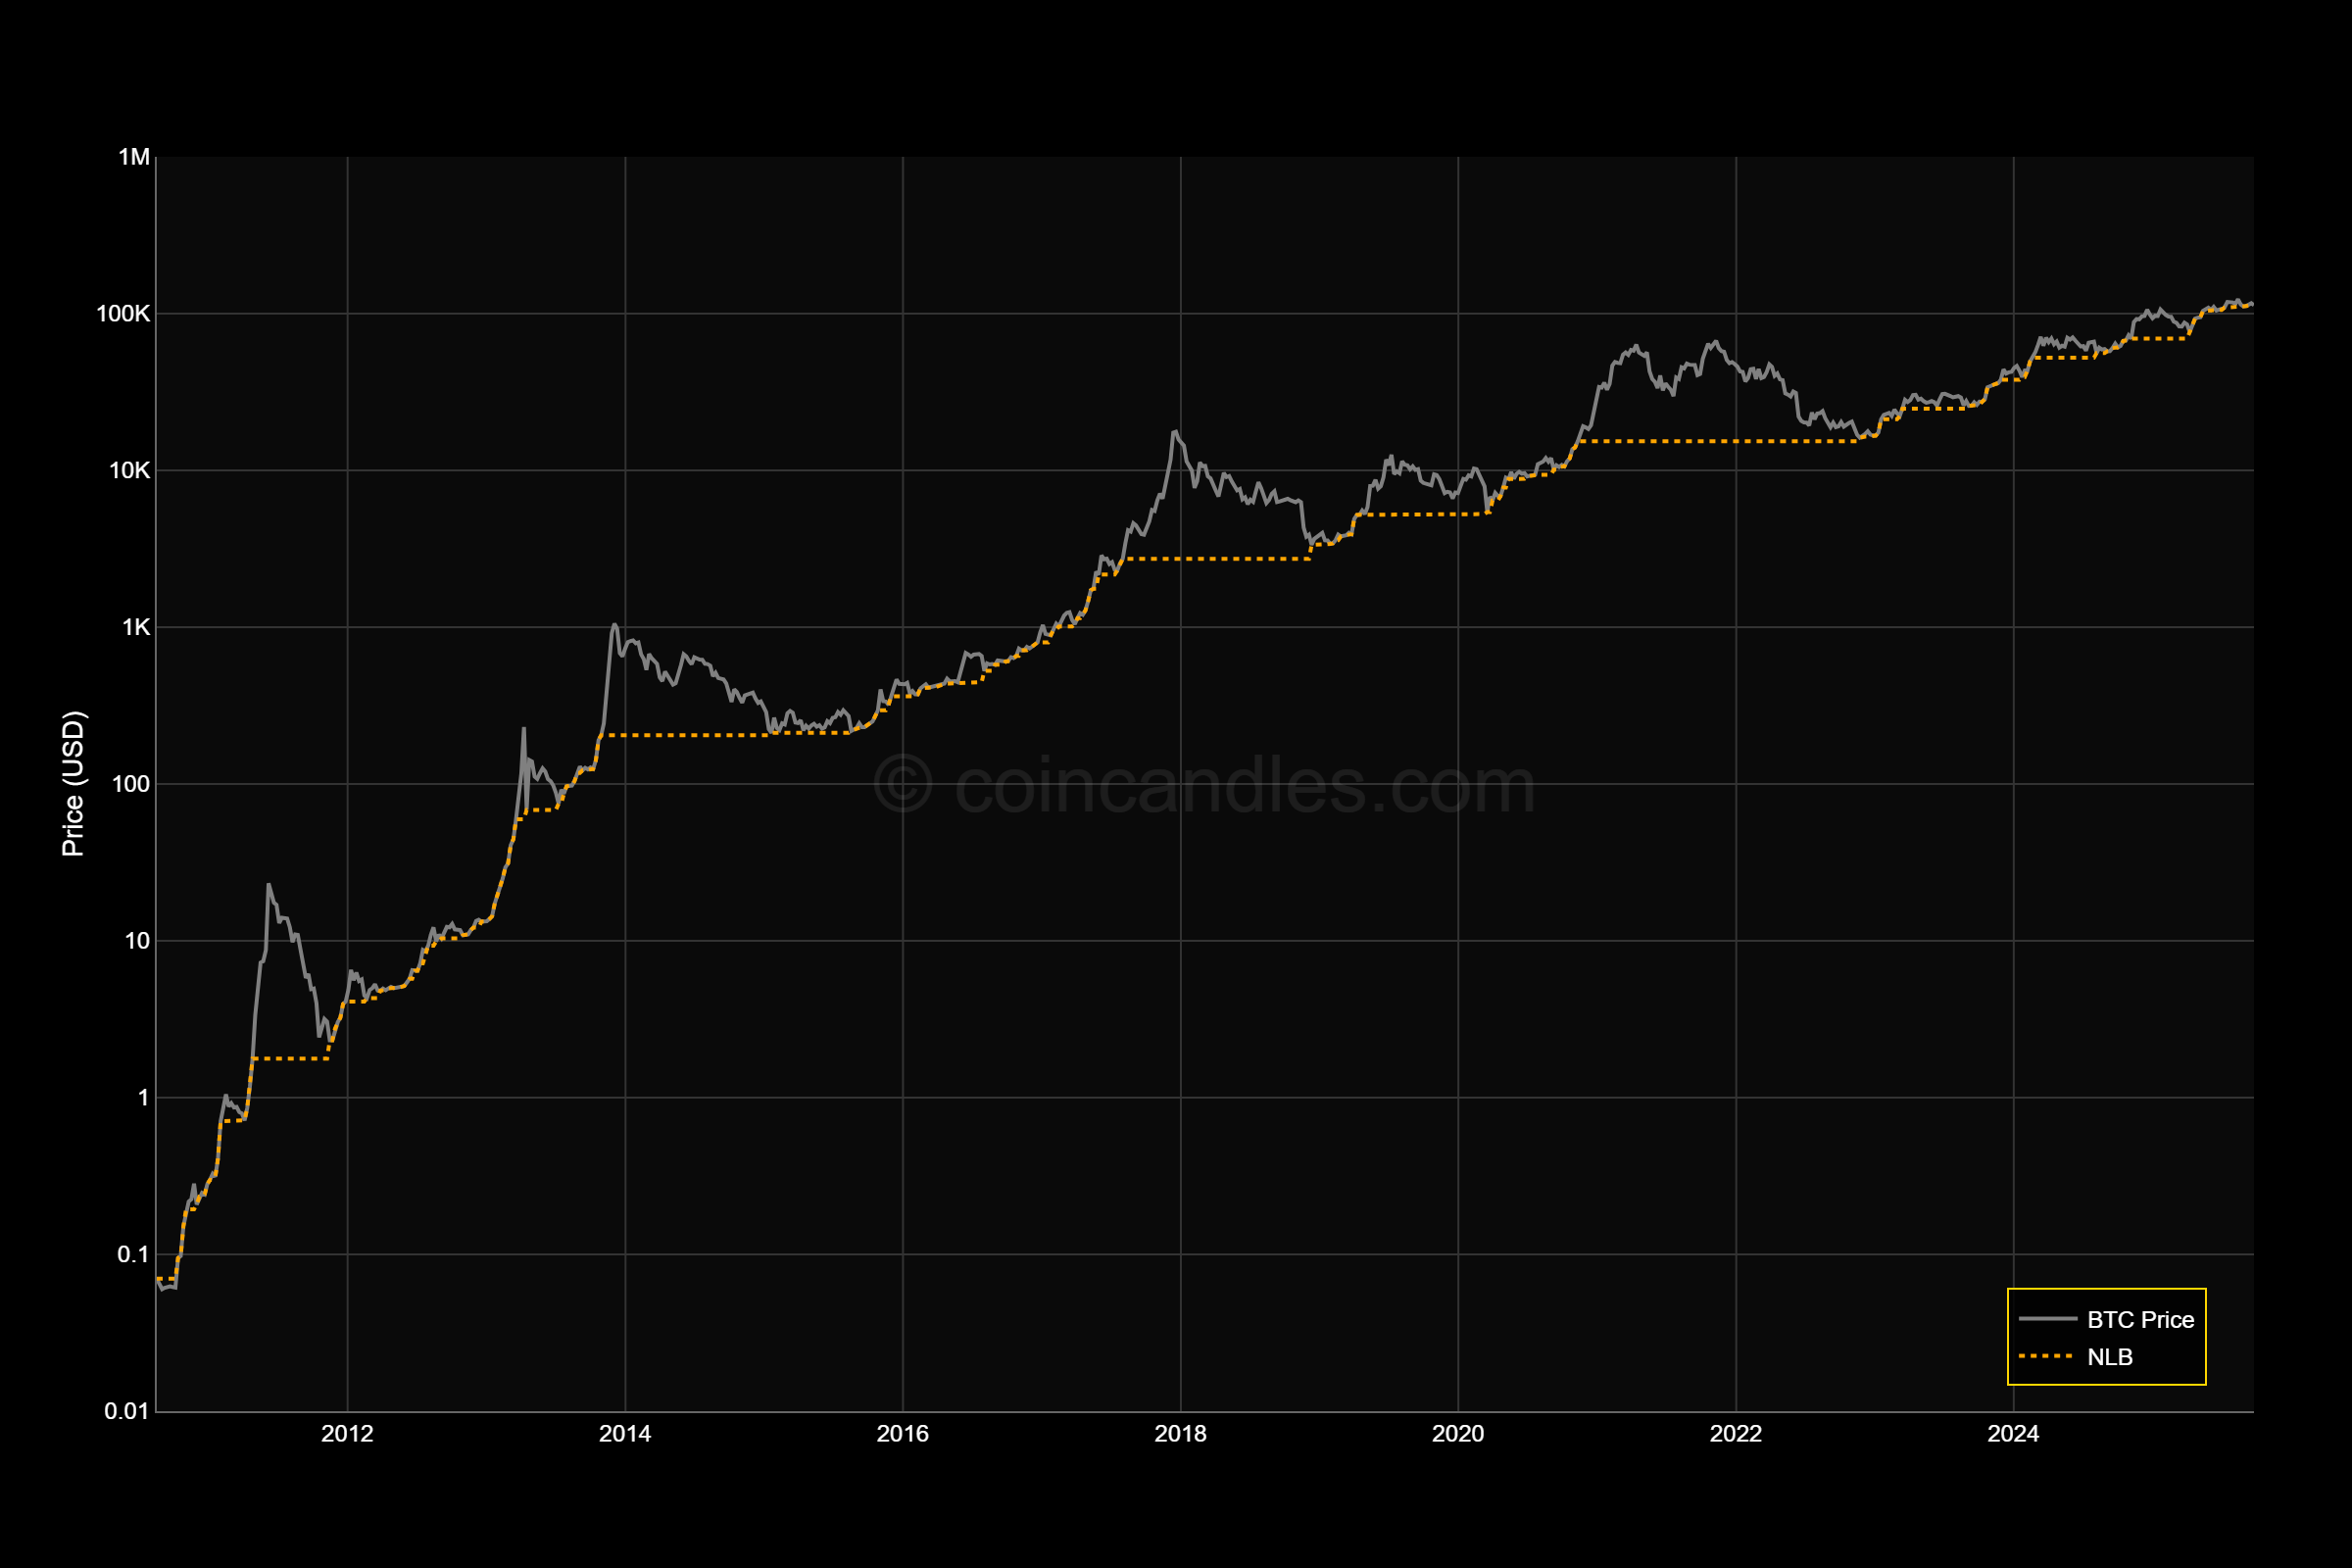
Never Look Back Price
Running ‘never‑revisited’ price floor highlighting levels that BTC historically did not trade below again.
Learn More
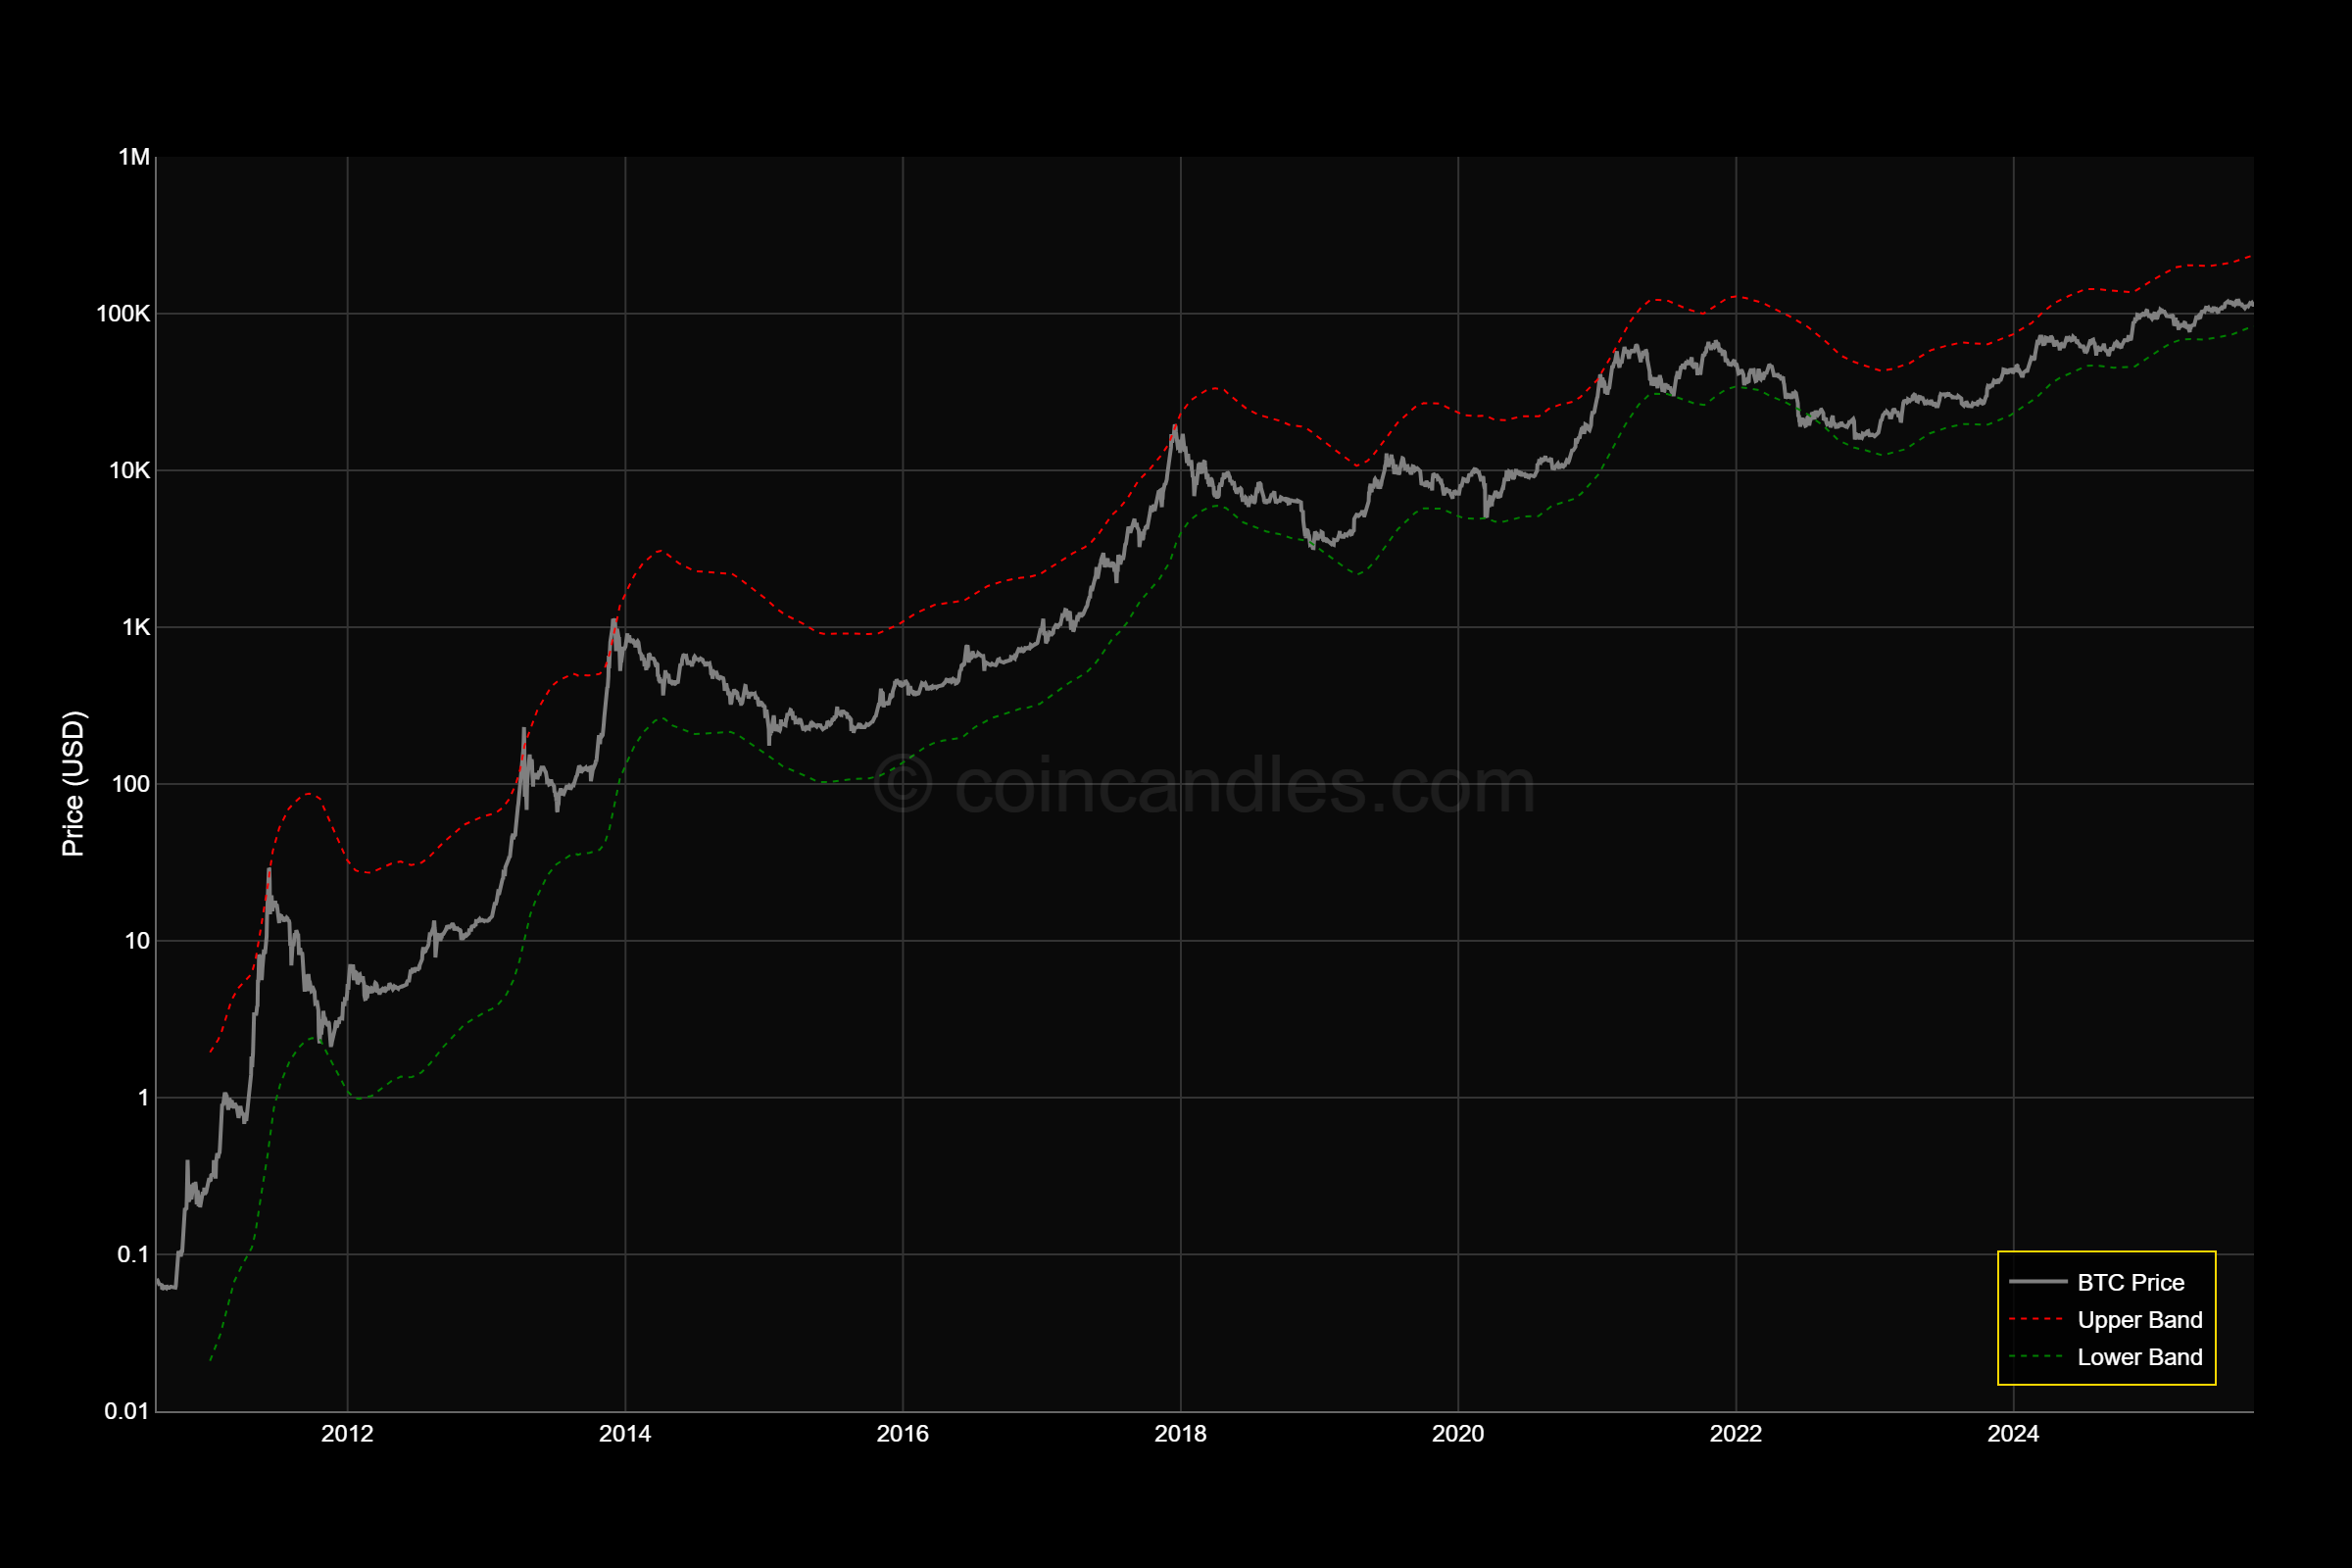
Bitcoin Historical Range Bands
Percentile‑based range bands to contextualize current price within historical distribution.
Learn More
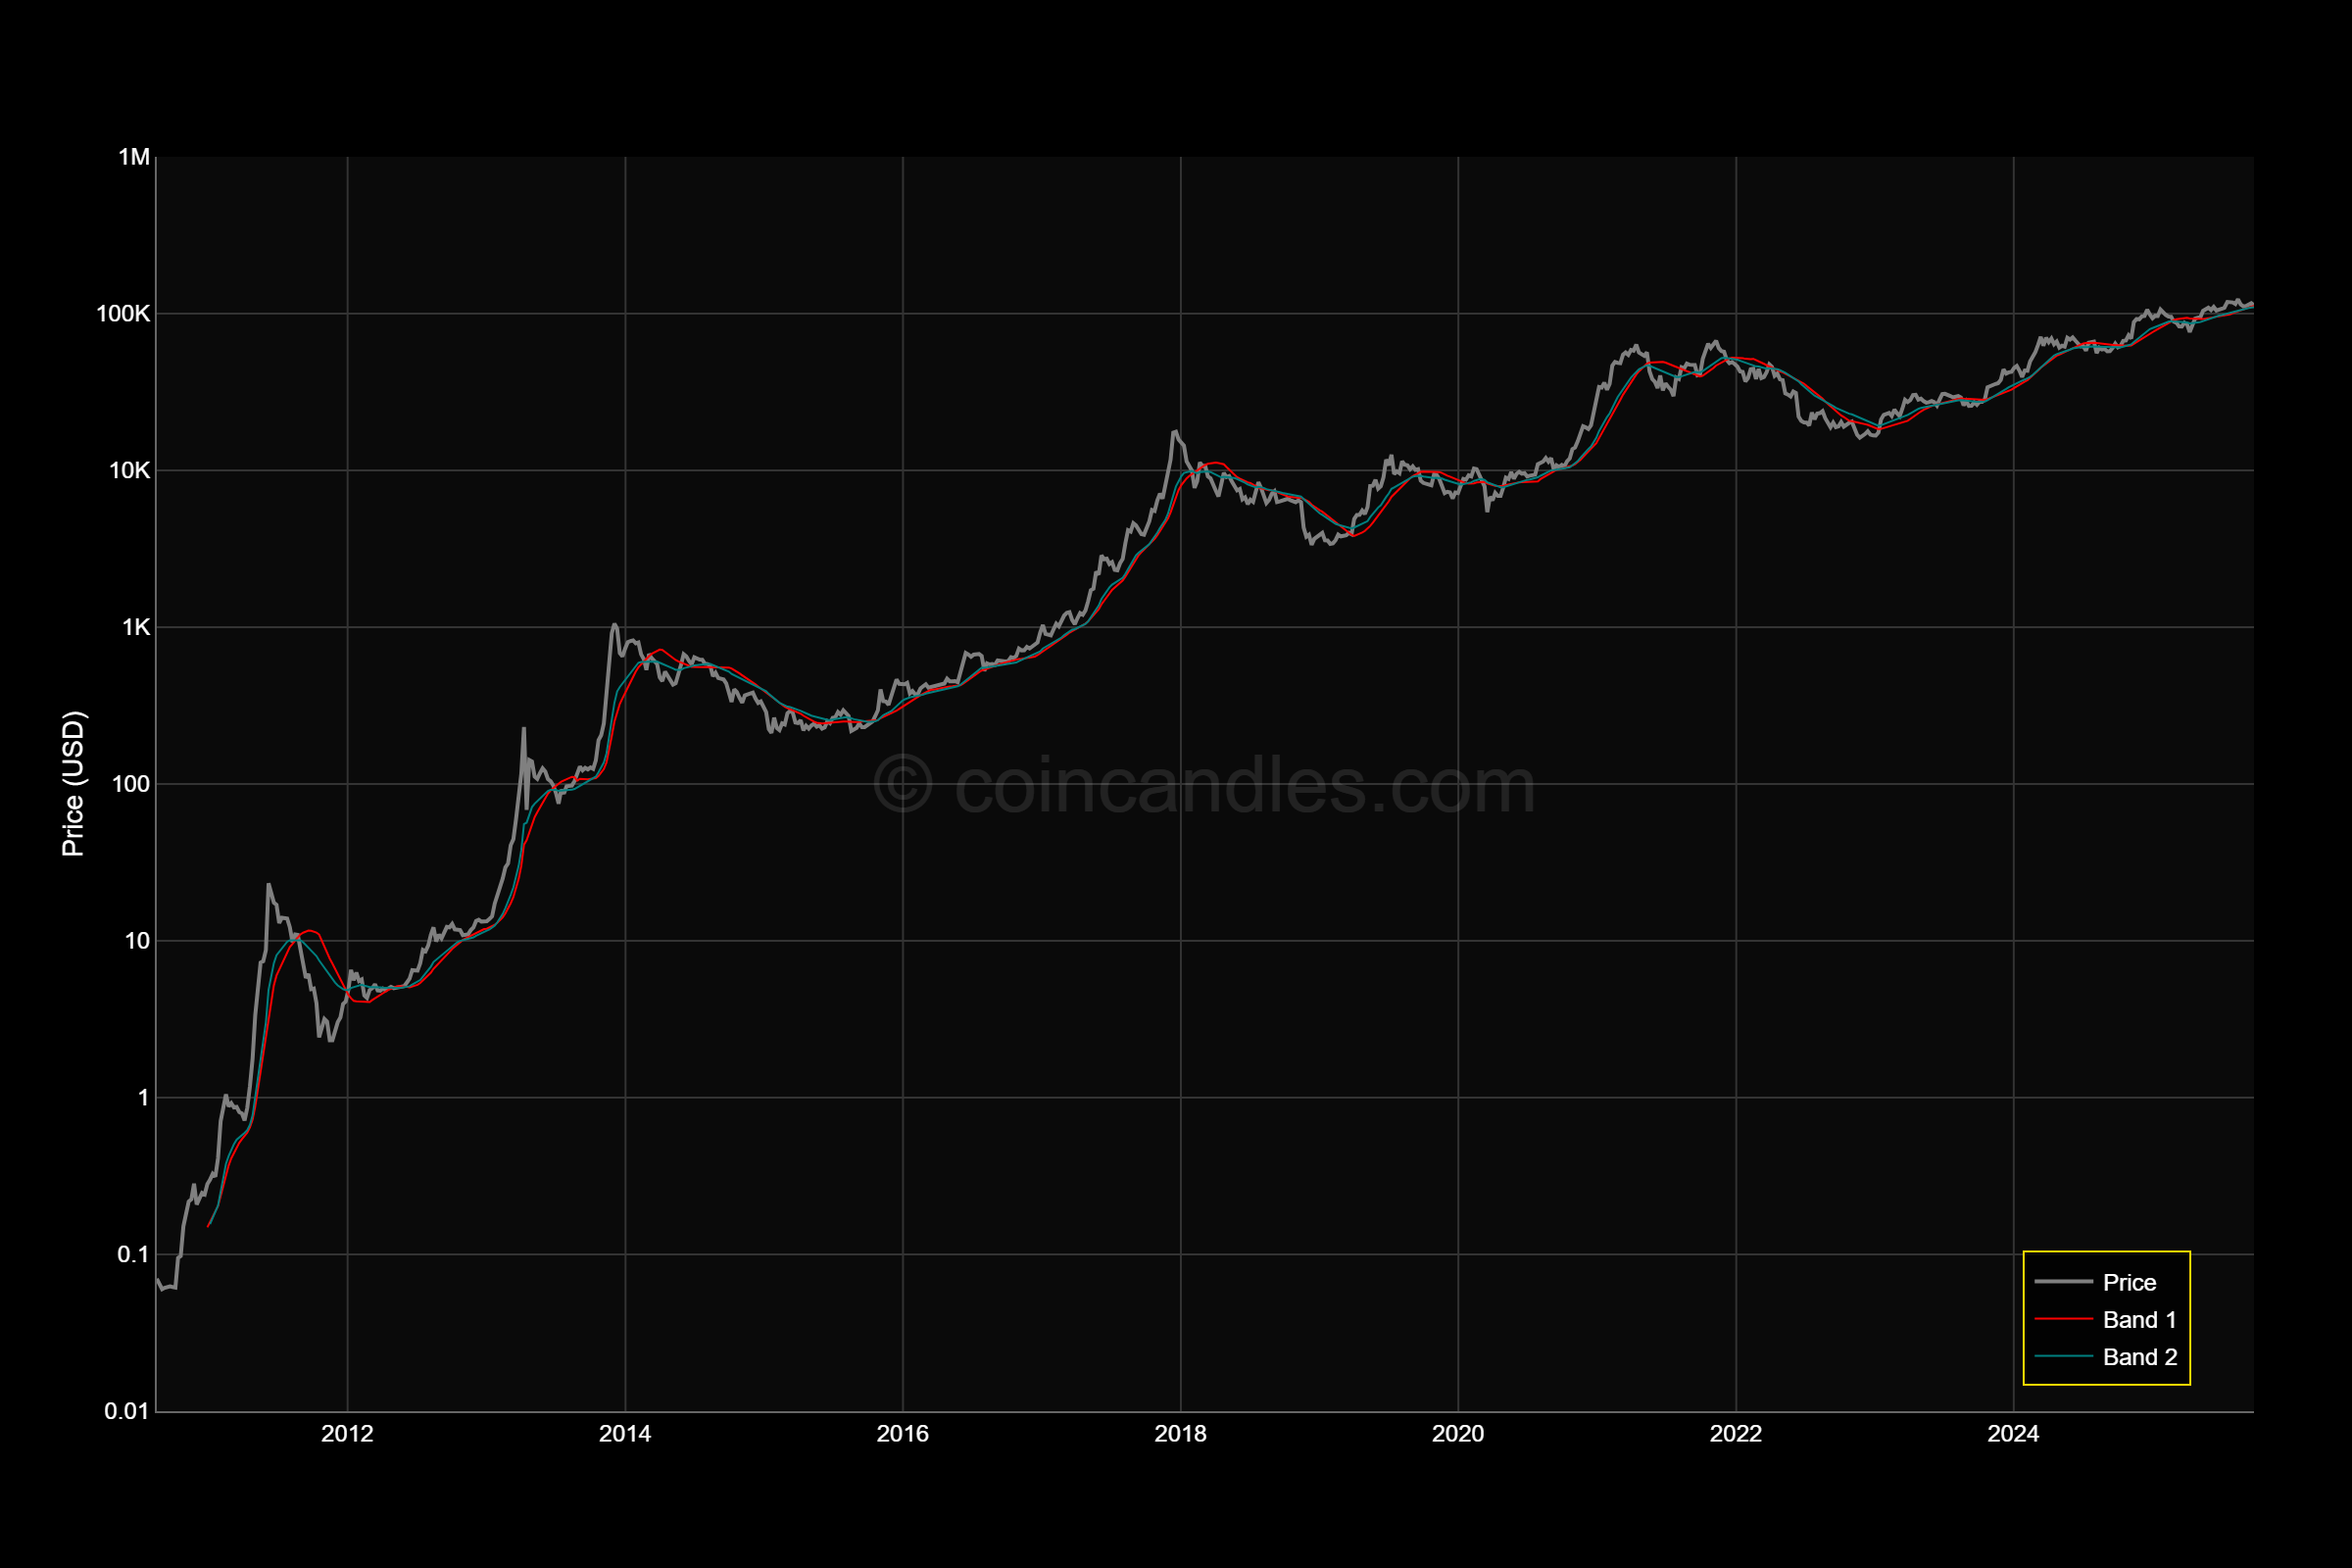
Bull Market Support Bands
20W SMA and 21W EMA ‘bull support’ bands often respected during uptrends.
Learn More
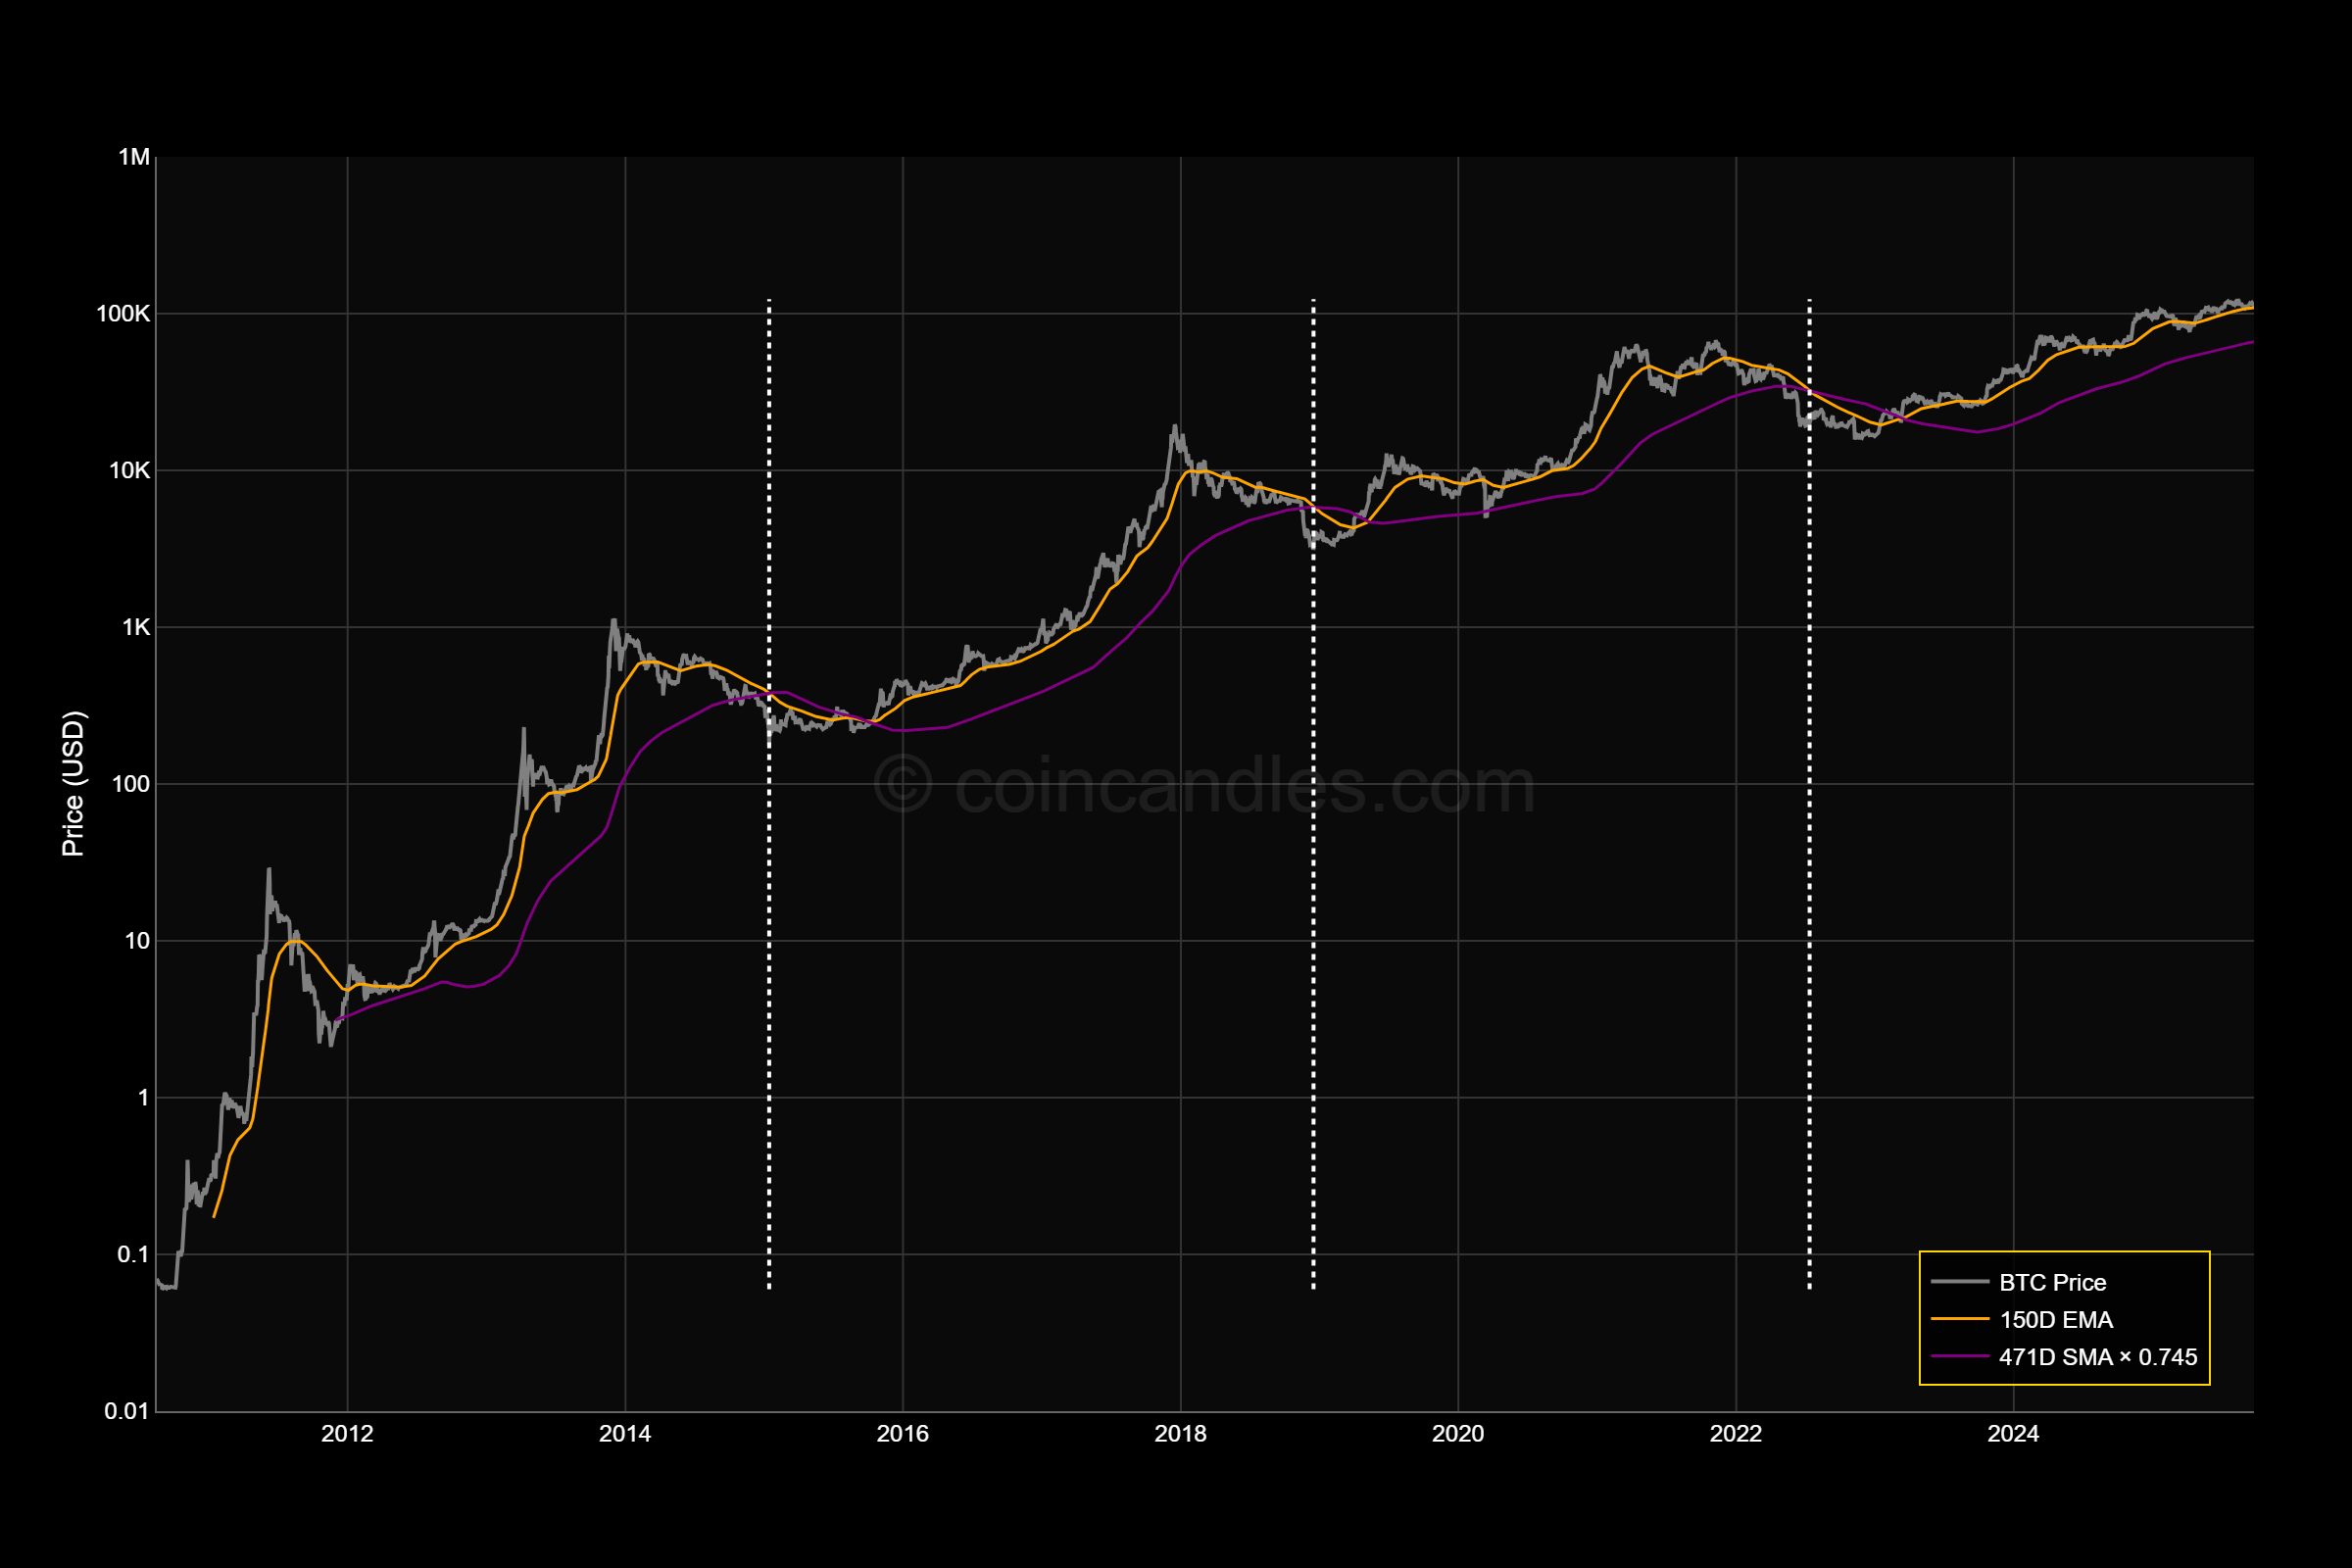
Pi Cycle Bottom
150‑day and 471‑day moving‑average relationship used to flag capitulation‑style cycle bottoms.
Learn More
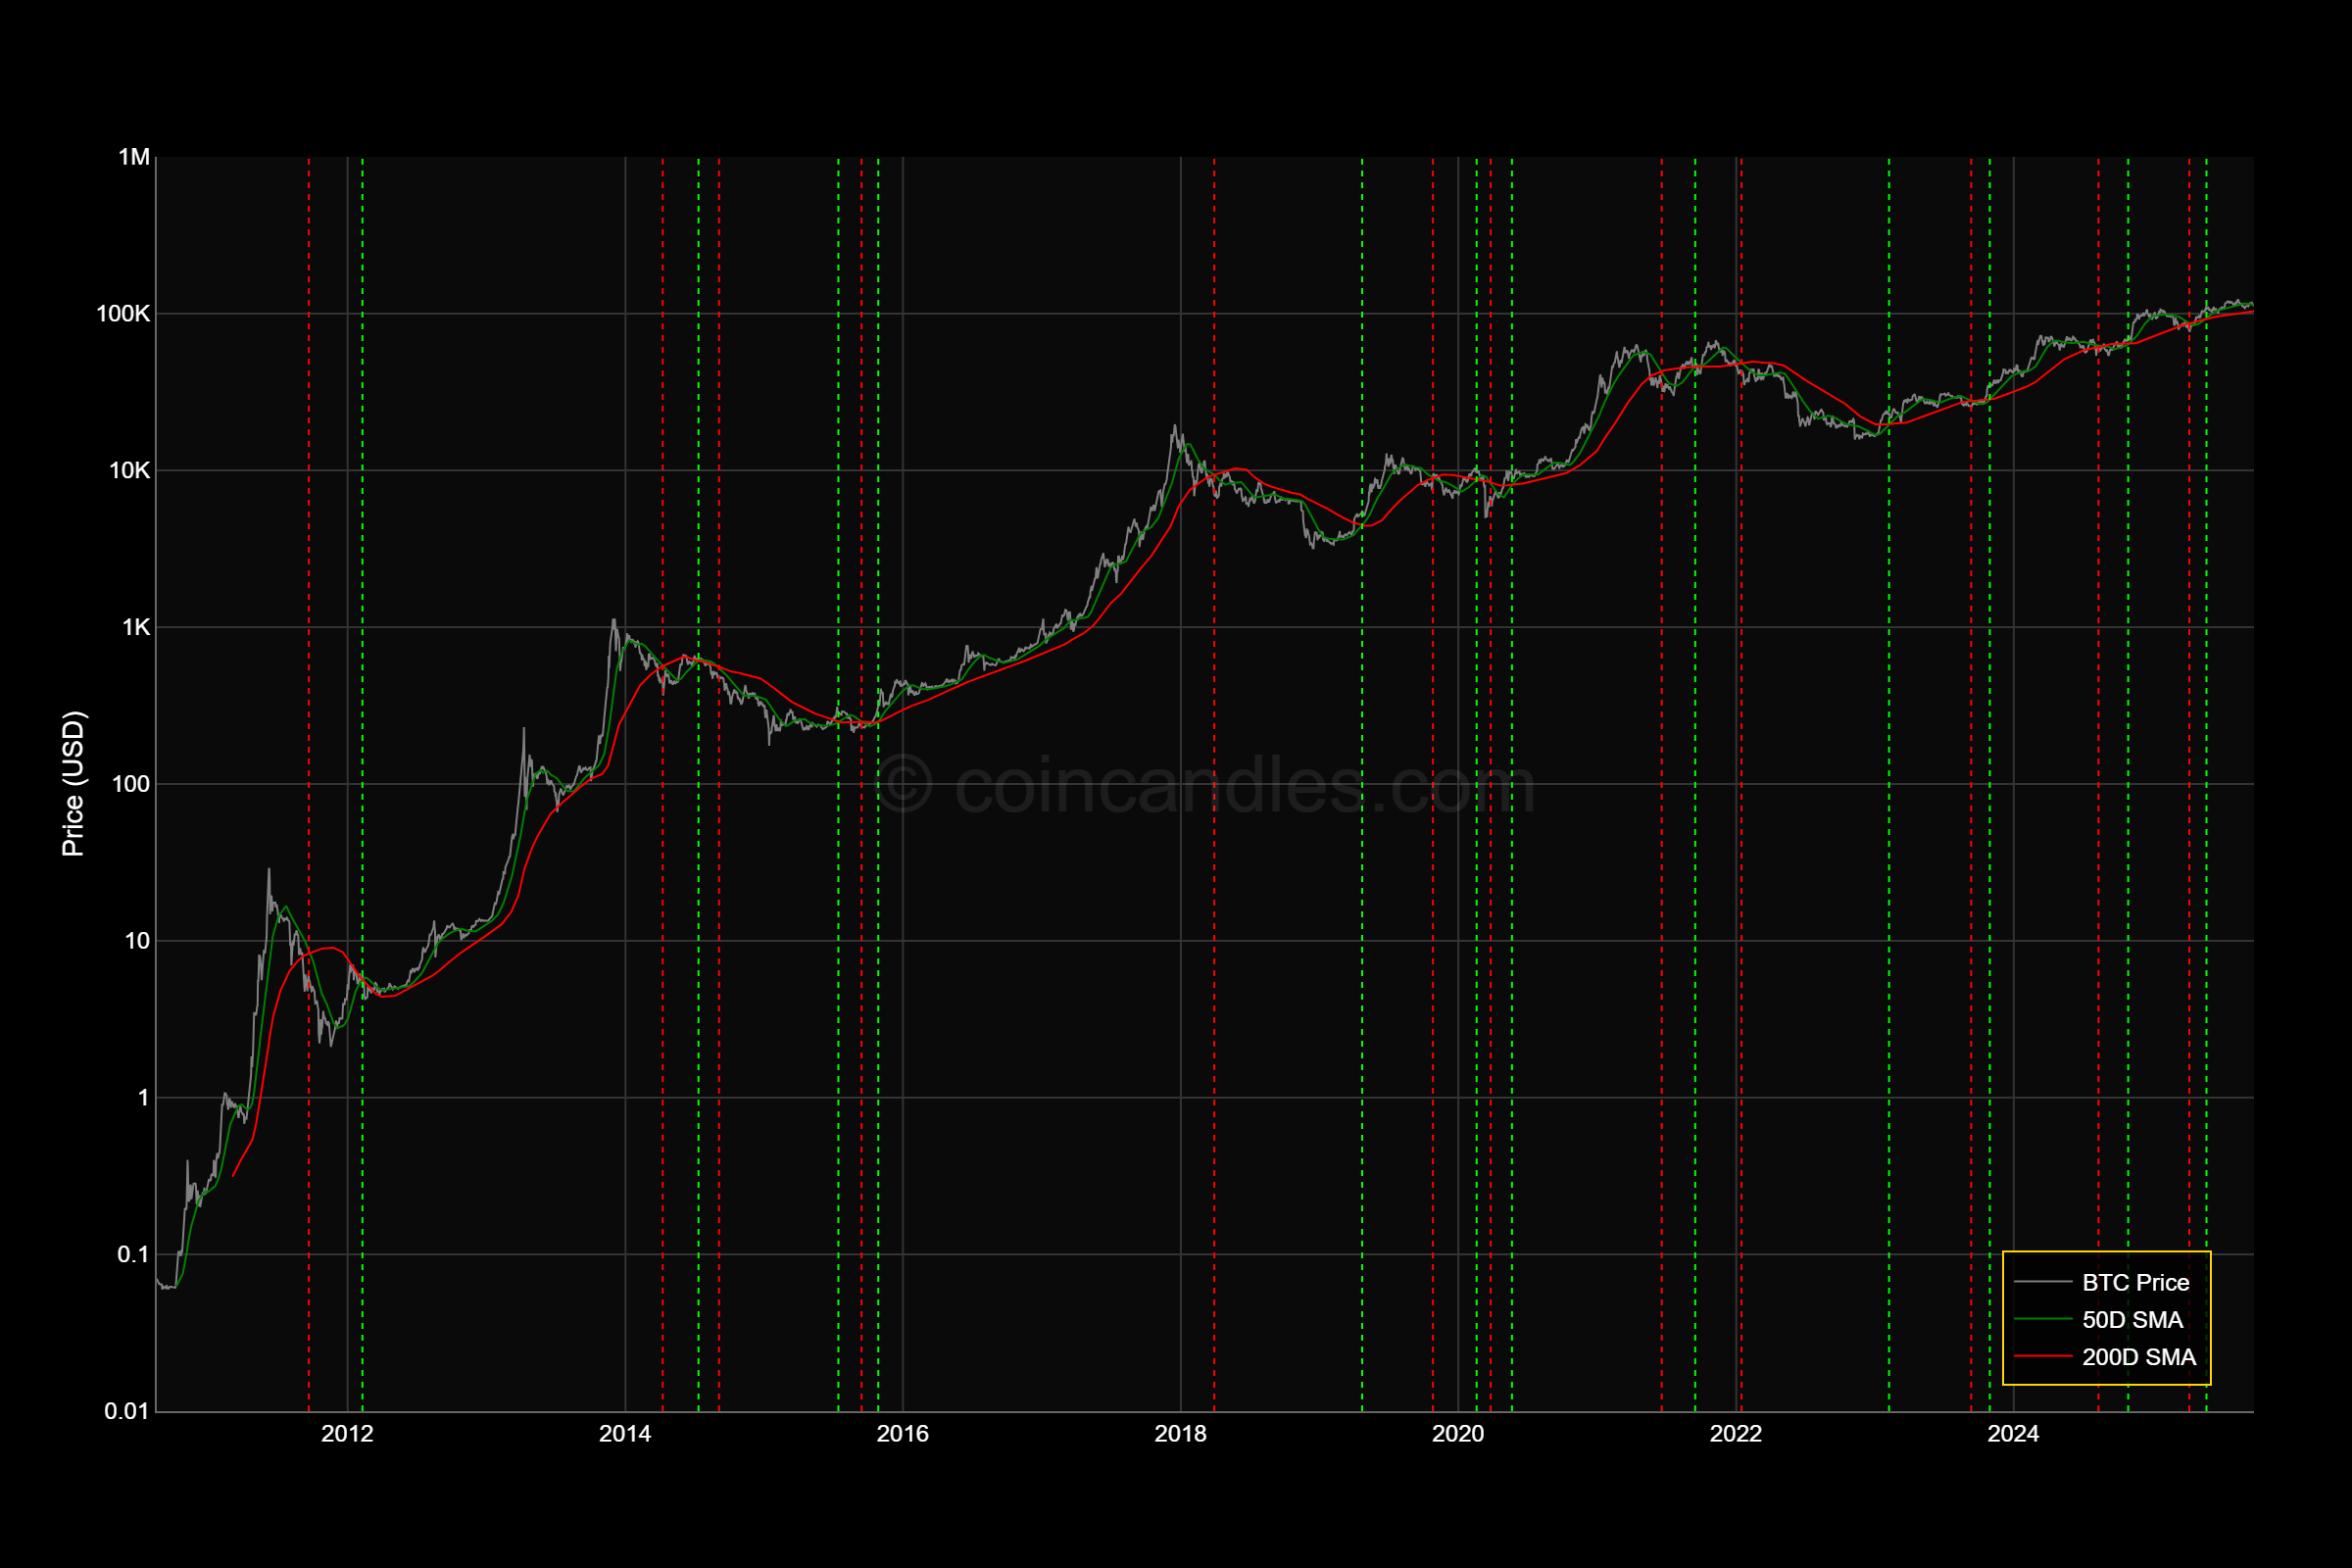
Golden/Death Cross
50D/200D SMA crossovers signaling potential trend transitions (bullish ‘golden’ vs bearish ‘death’).
Learn More
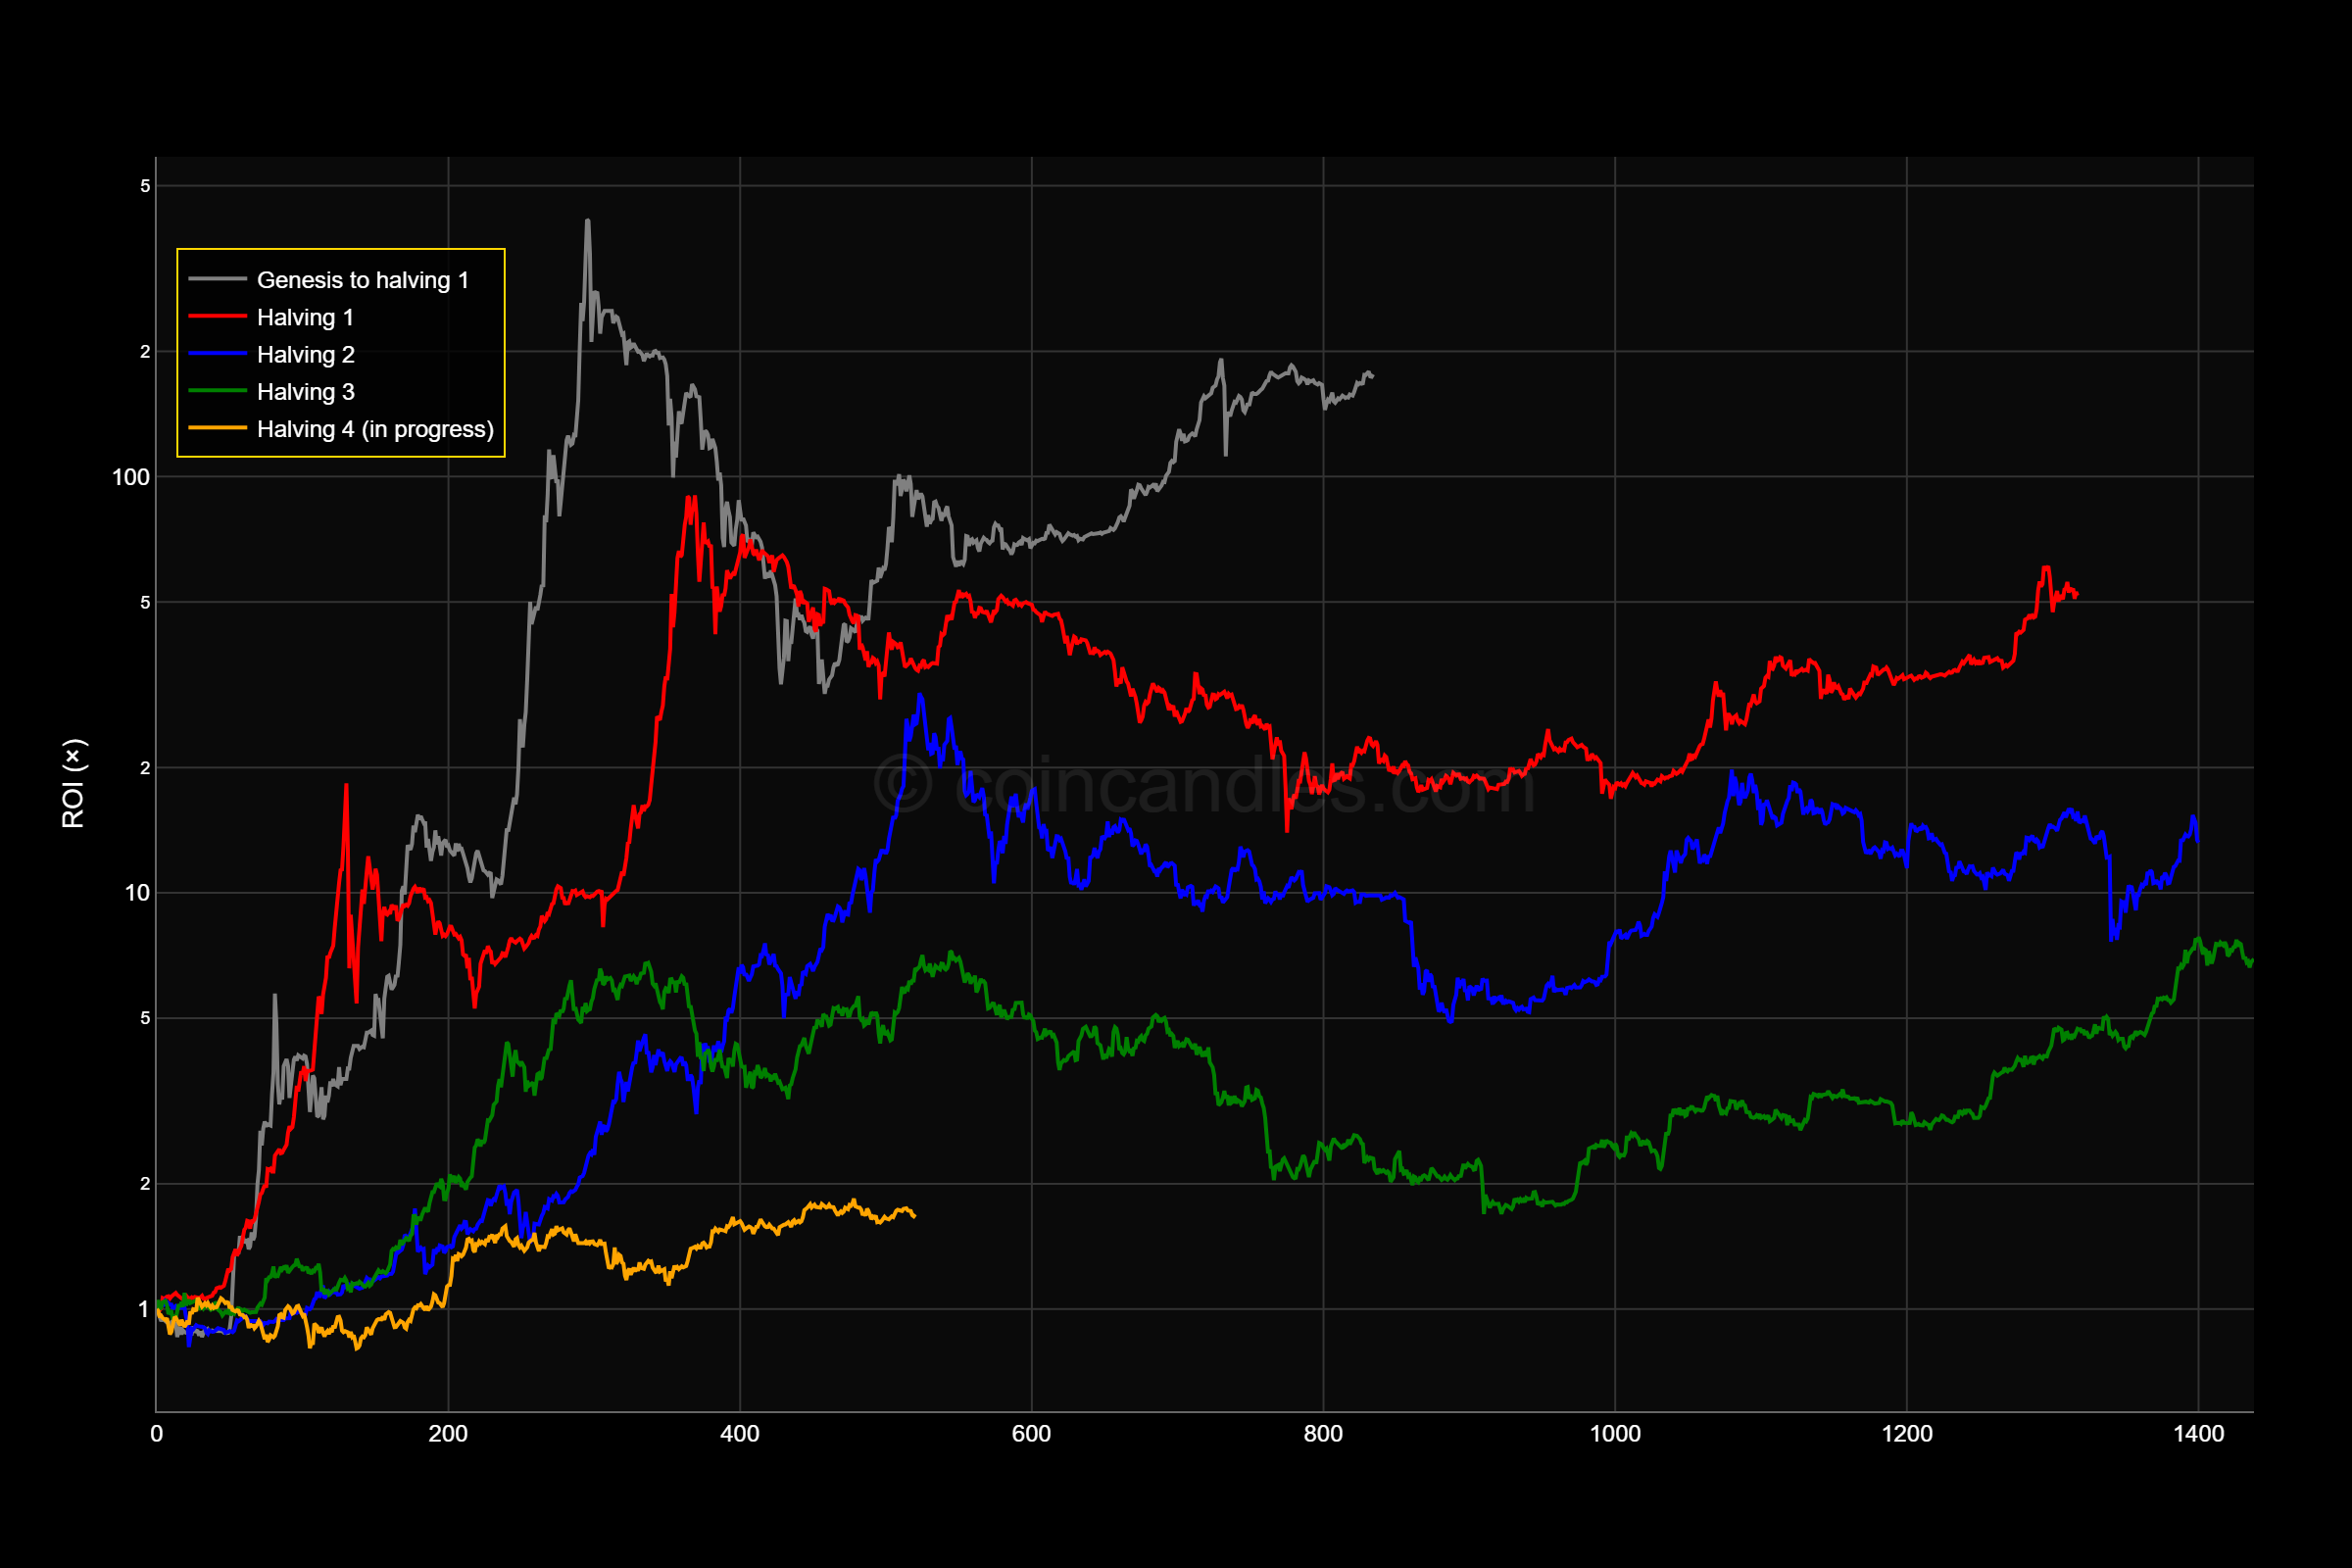
BTC ROI Since Halving
Cumulative performance from each halving date to compare post‑halving market behaviors.
Learn More
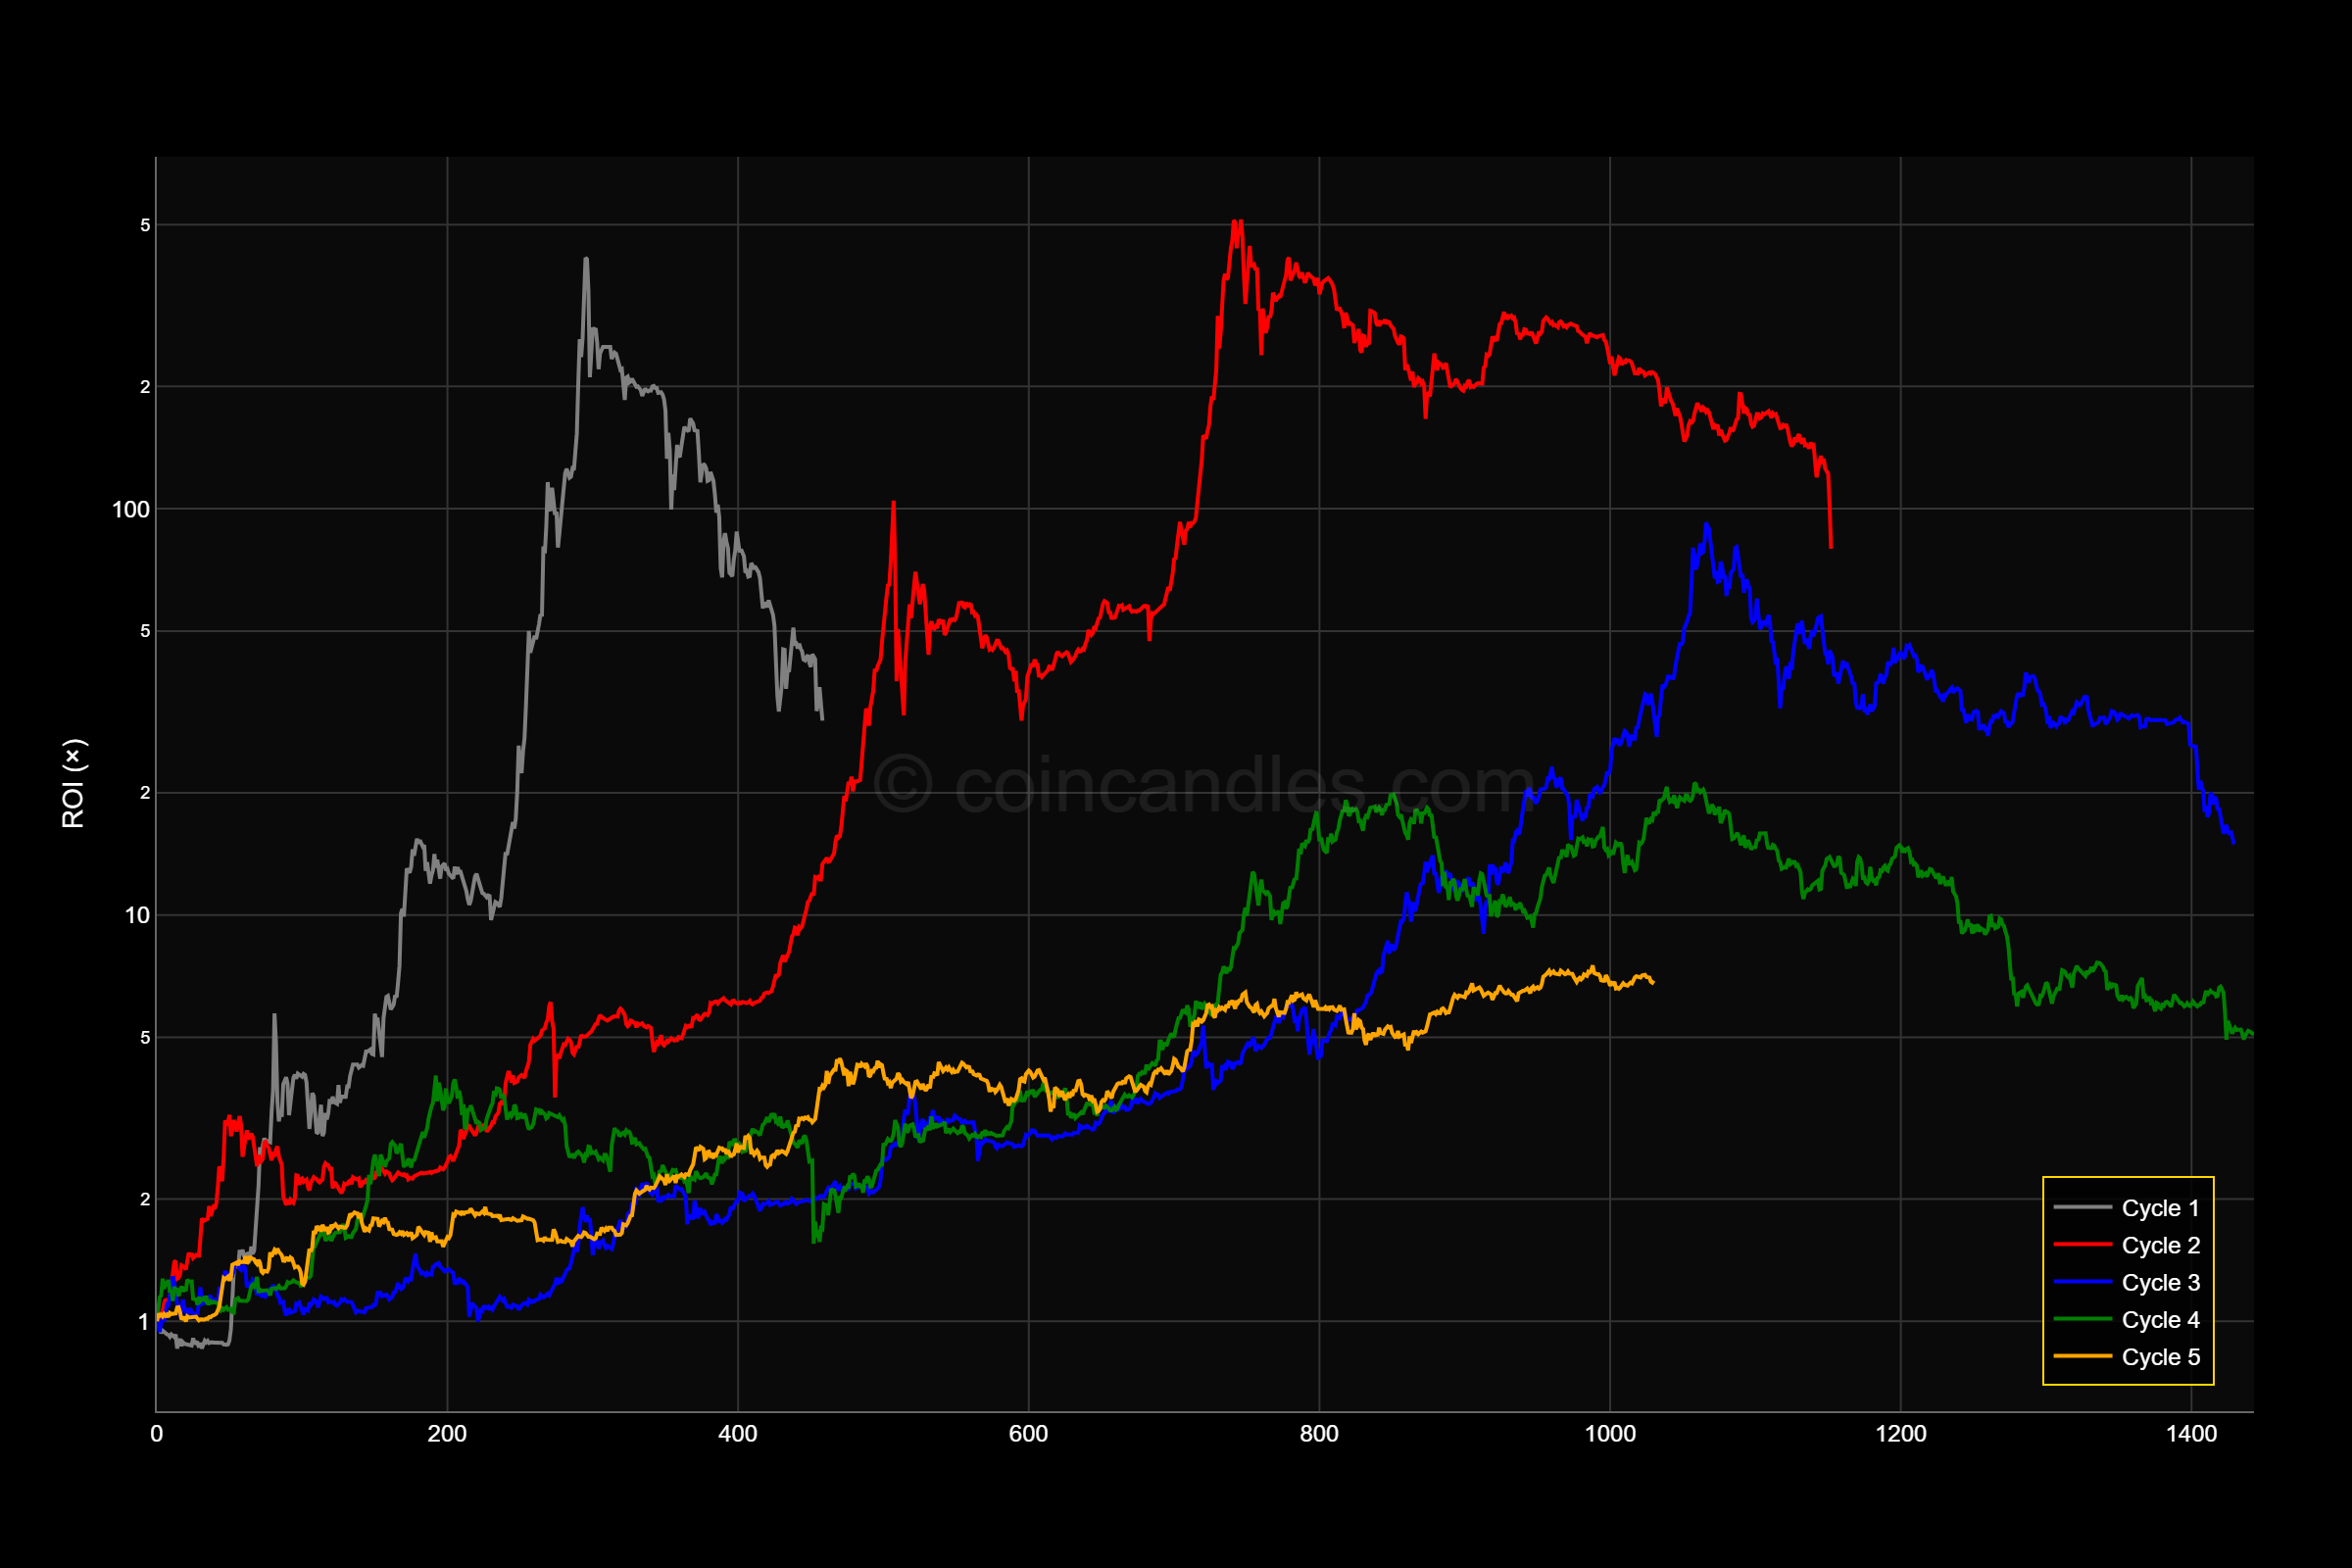
BTC ROI Since Market Cycle Bottoms
Cumulative returns measured from identified cycle lows across multiple market cycles.
Learn More

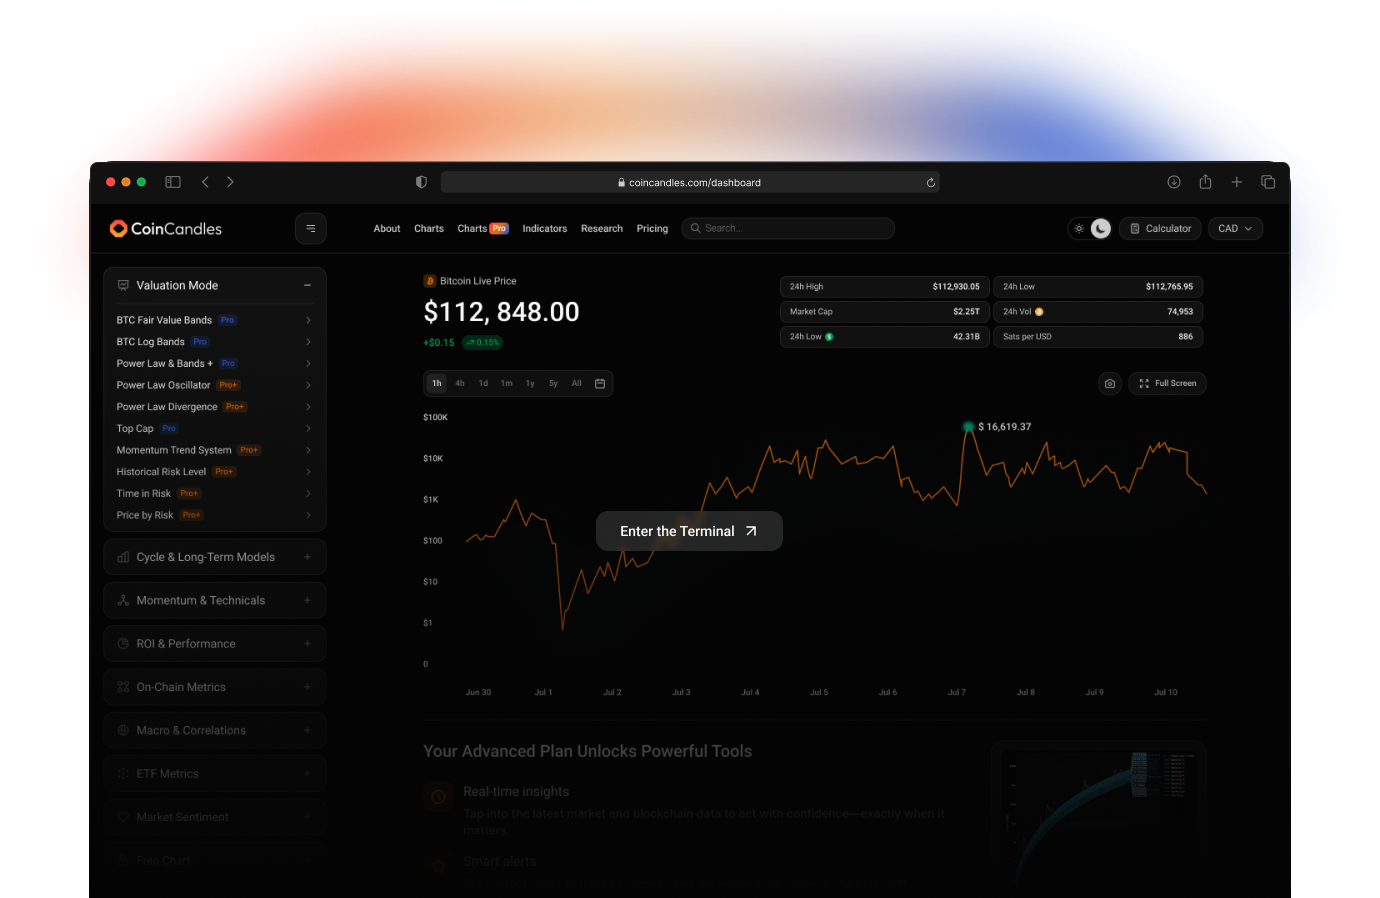
powered by data.
Lite Plan
Perfect for casual users exploring Bitcoin data.
Pro Plan
Ideal for serious traders and analysts who want full charting power.
Pro+ Plan
Designed for professionals, funds, and power users who need unlimited access + deep integration.